Introduction
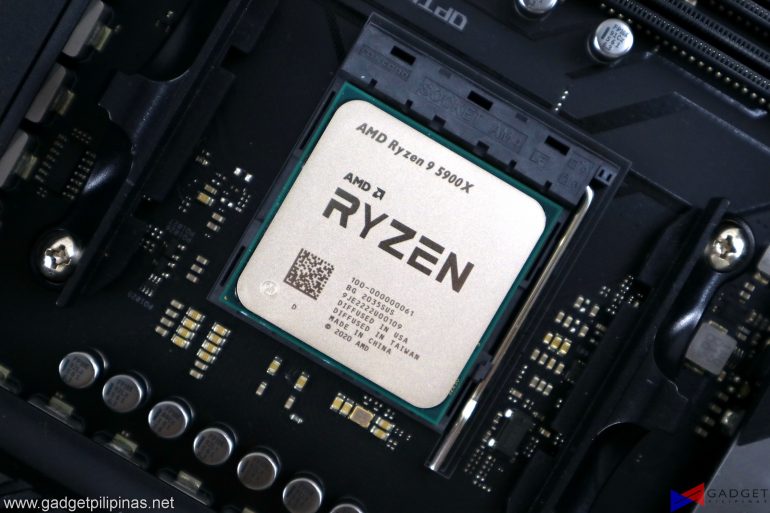
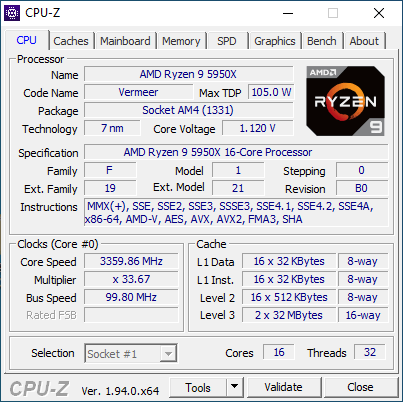
It’s no secret that AMD has been continuously improving its processors in every aspect. As the brand continues to catch up to Intel’s performance, AMD scales its pricing to reflect the industry’s shift from blue to red. Thanks to AMD’s latest Zen 3 architecture, AMD has successfully overtaken Intel with its Ryzen 5000 series processors, not only in performance but in pricing as well. AMD’s latest flagship CPU, the AMD Ryzen 9 5950X, represents the brand’s performance leadership in the market as it’s the most expensive mainstream desktop CPU to date, priced at $799 US or Php 44,900. But does the overall performance improvement justify AMD’s significant price increase? Let’s find out.
AMD Zen 3 Overview
The Ryzen 5000 series processors are still under the 7-nanometer process node by TSMC but are under an all-new Zen 3 architecture. In AMD’s last press event, Lisa Su talked about the Ryzen 5000 series processors getting a 19-percent Instructions Per Clock uplift and a massive performance-per-watt efficiency. AMD did a ground-up redesign with the Zen 3 architecture to achieve a +19% IPC uplift alongside some functionality improvements over the previous Zen 2 architecture.
Achieving +19% IPC
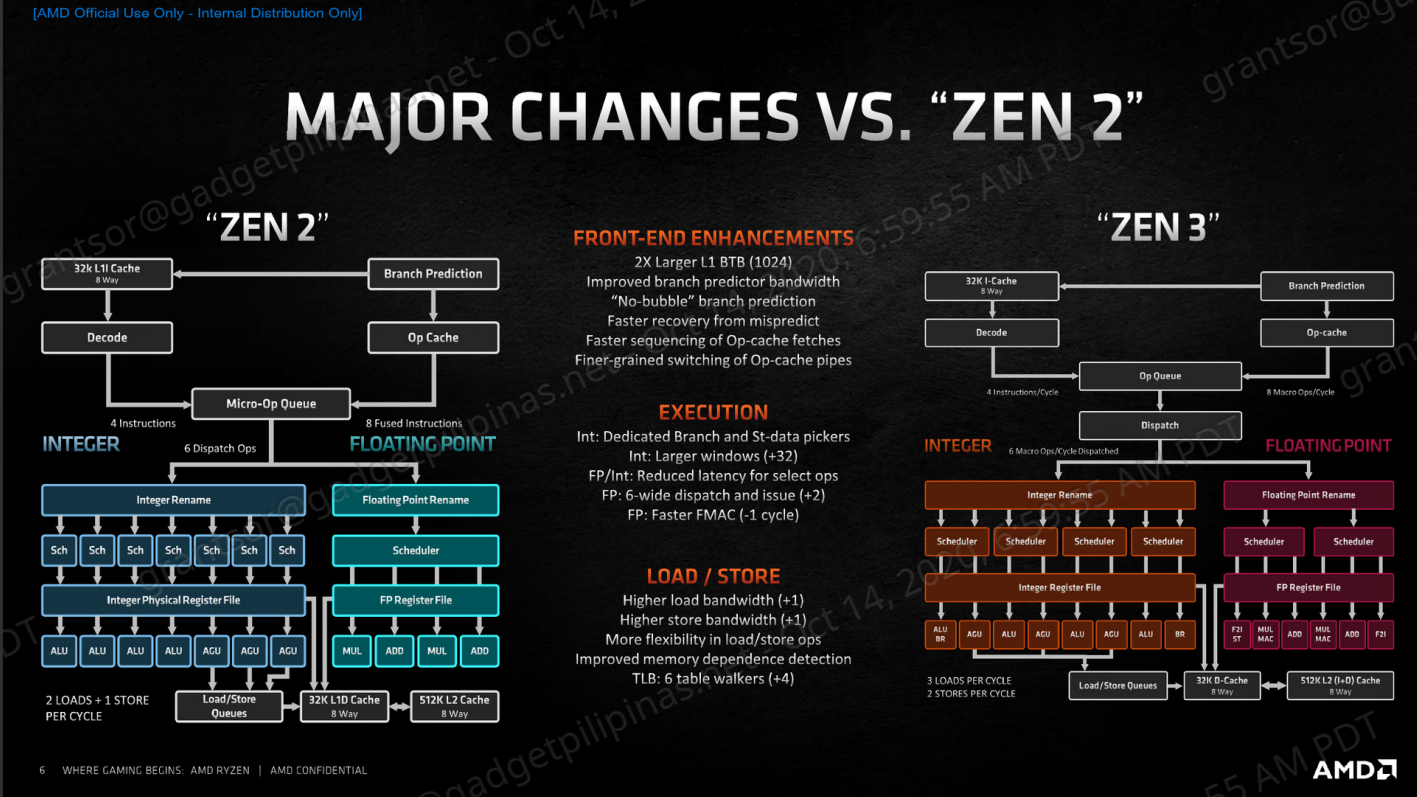
AMD’s engineering team did remarkable work with the Zen 3 CPUs as they improved the pipeline allowing for faster fetching, reduced latency, and reduced memory and cache dependency.
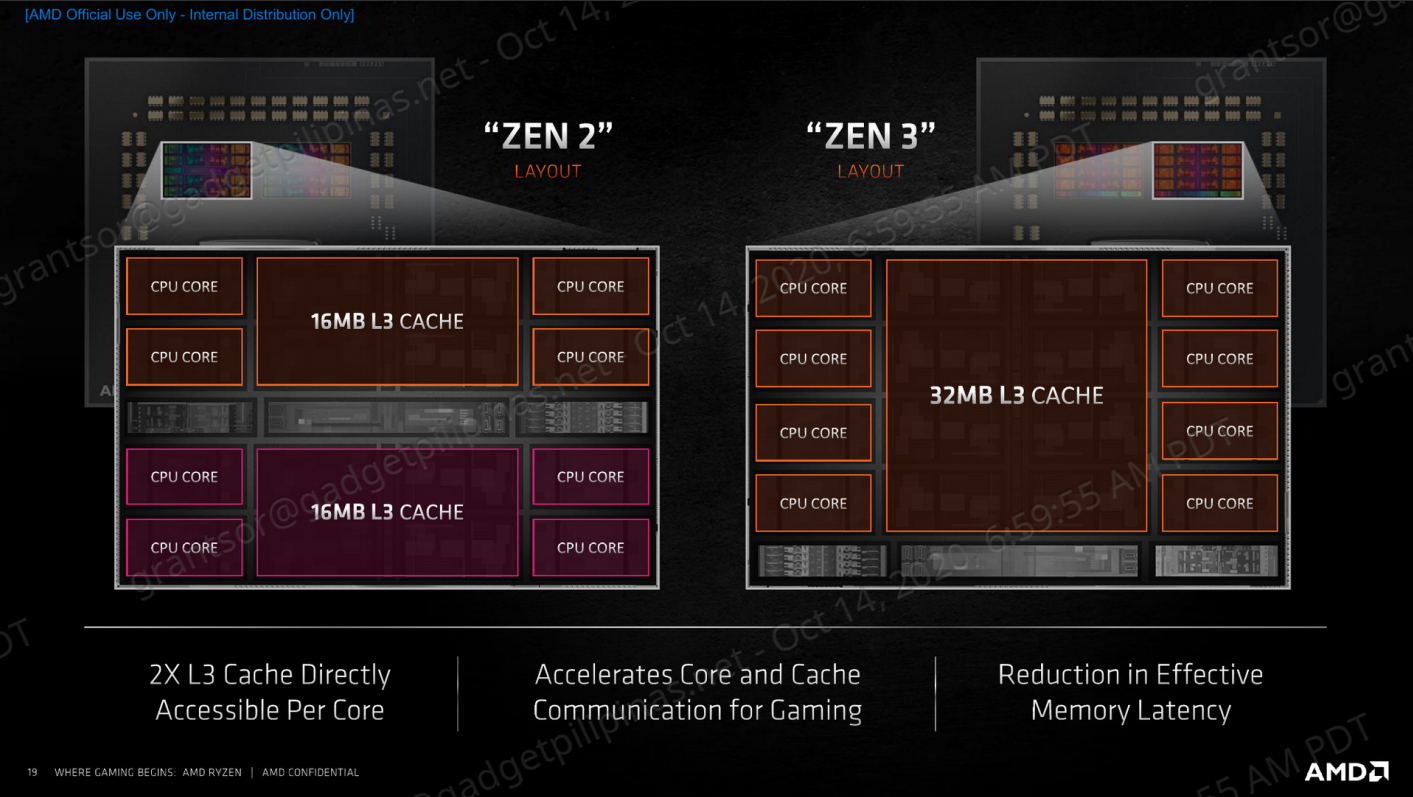
The AMD Ryzen 5000 series has undergone design changes at the SoC architecture as well. Zen 2 CPUs utilized a union of two core complexes(CCX) per compute die(CCD), whereas Zen 3 processors now feature a unified CCD meaning each CCX can consist of up to 8C/16T & 32MB L3 Cache instead of Zen 2’s 4C/8T & 16MB L3 Cache per CCX. The consolidated core and cache complex on Zen allows better performance, especially on latency-sensitive workloads. The Zen 3 layout design eliminates CCX-to-CCX communication within the die and enables a direct-access pool of the 32MB L3 Cache. CPU intensive games will significantly benefit from Zen’s redesigned CCD and CCX layout
AMD Ryzen 5000 Processors Spec Sheet, Price, and PH SRP
| AMD Ryzen 5000 CPUs | ||||||
| CPU | Cores/threads | Base/Boost Clock (GHz) | TDP | L2 + L3 Cache | Launch Price – USD | PH SRP |
| Ryzen 9 5950X | 16/32 | 3.4/4.9 | 105W | 72MB | $799 | ₱44,900 |
| Ryzen 9 5900X | 12/24 | 3.7/4.8 | 105W | 70MB | $549 | ₱30,250 |
| Ryzen 7 5800X | 8/16 | 3.8/4.7 | 105W | 36MB | $449 | ₱24,800 |
| Ryzen 5 5600X | 6/12 | 3.7/4.6 | 65W | 35MB | $299 | ₱16,550 |
| Ryzen 9 3950X | 16/32 | 3.5/4.7 | 105W | 72MB | $749 | ₱42,000 |
| Ryzen 9 3900X | 12/24 | 3.8/4.7 | 105W | 70MB | $499 | ₱29,470 |
| Ryzen 7 3800X | 8/16 | 3.9/4.7 | 105W | 32MB | $399 | ₱23,185 |
| Intel Core i9 10900K | 10/20 | 3.7/5.3 | 125W | 20MB | $488 | ₱29,990 |
Of course, all of the improvements AMD made with the 7-nanometer Zen 3 architecture needs to be recuperated. AMD boasted a 19% IPC performance improvement, but that comes with a huge asterisk as AMD also hiked up its launch prices compared to the previous generation. We decided to compare the Ryzen 5000 processors against the non-XT predecessors as the XT series are just “refreshed” versions. The Flagship Ryzen 9 5950X is at a price where Intel doesn’t have anything to compete with. The $799 AMD Ryzen 9 5950X is $50 more expensive than the 3950X when it first launched. The Ryzen 9 5900X also receives the same $50 price increase compared to the 3900X.
Our AMD Ryzen 9 5950X review shares some data and information with our Ryzen 9 5900X Review. If you’ve read the latter, we recommend skipping to the last page for our thoughts about the AMD Ryzen 9 5950X.
Benchmark Setup and Methodology
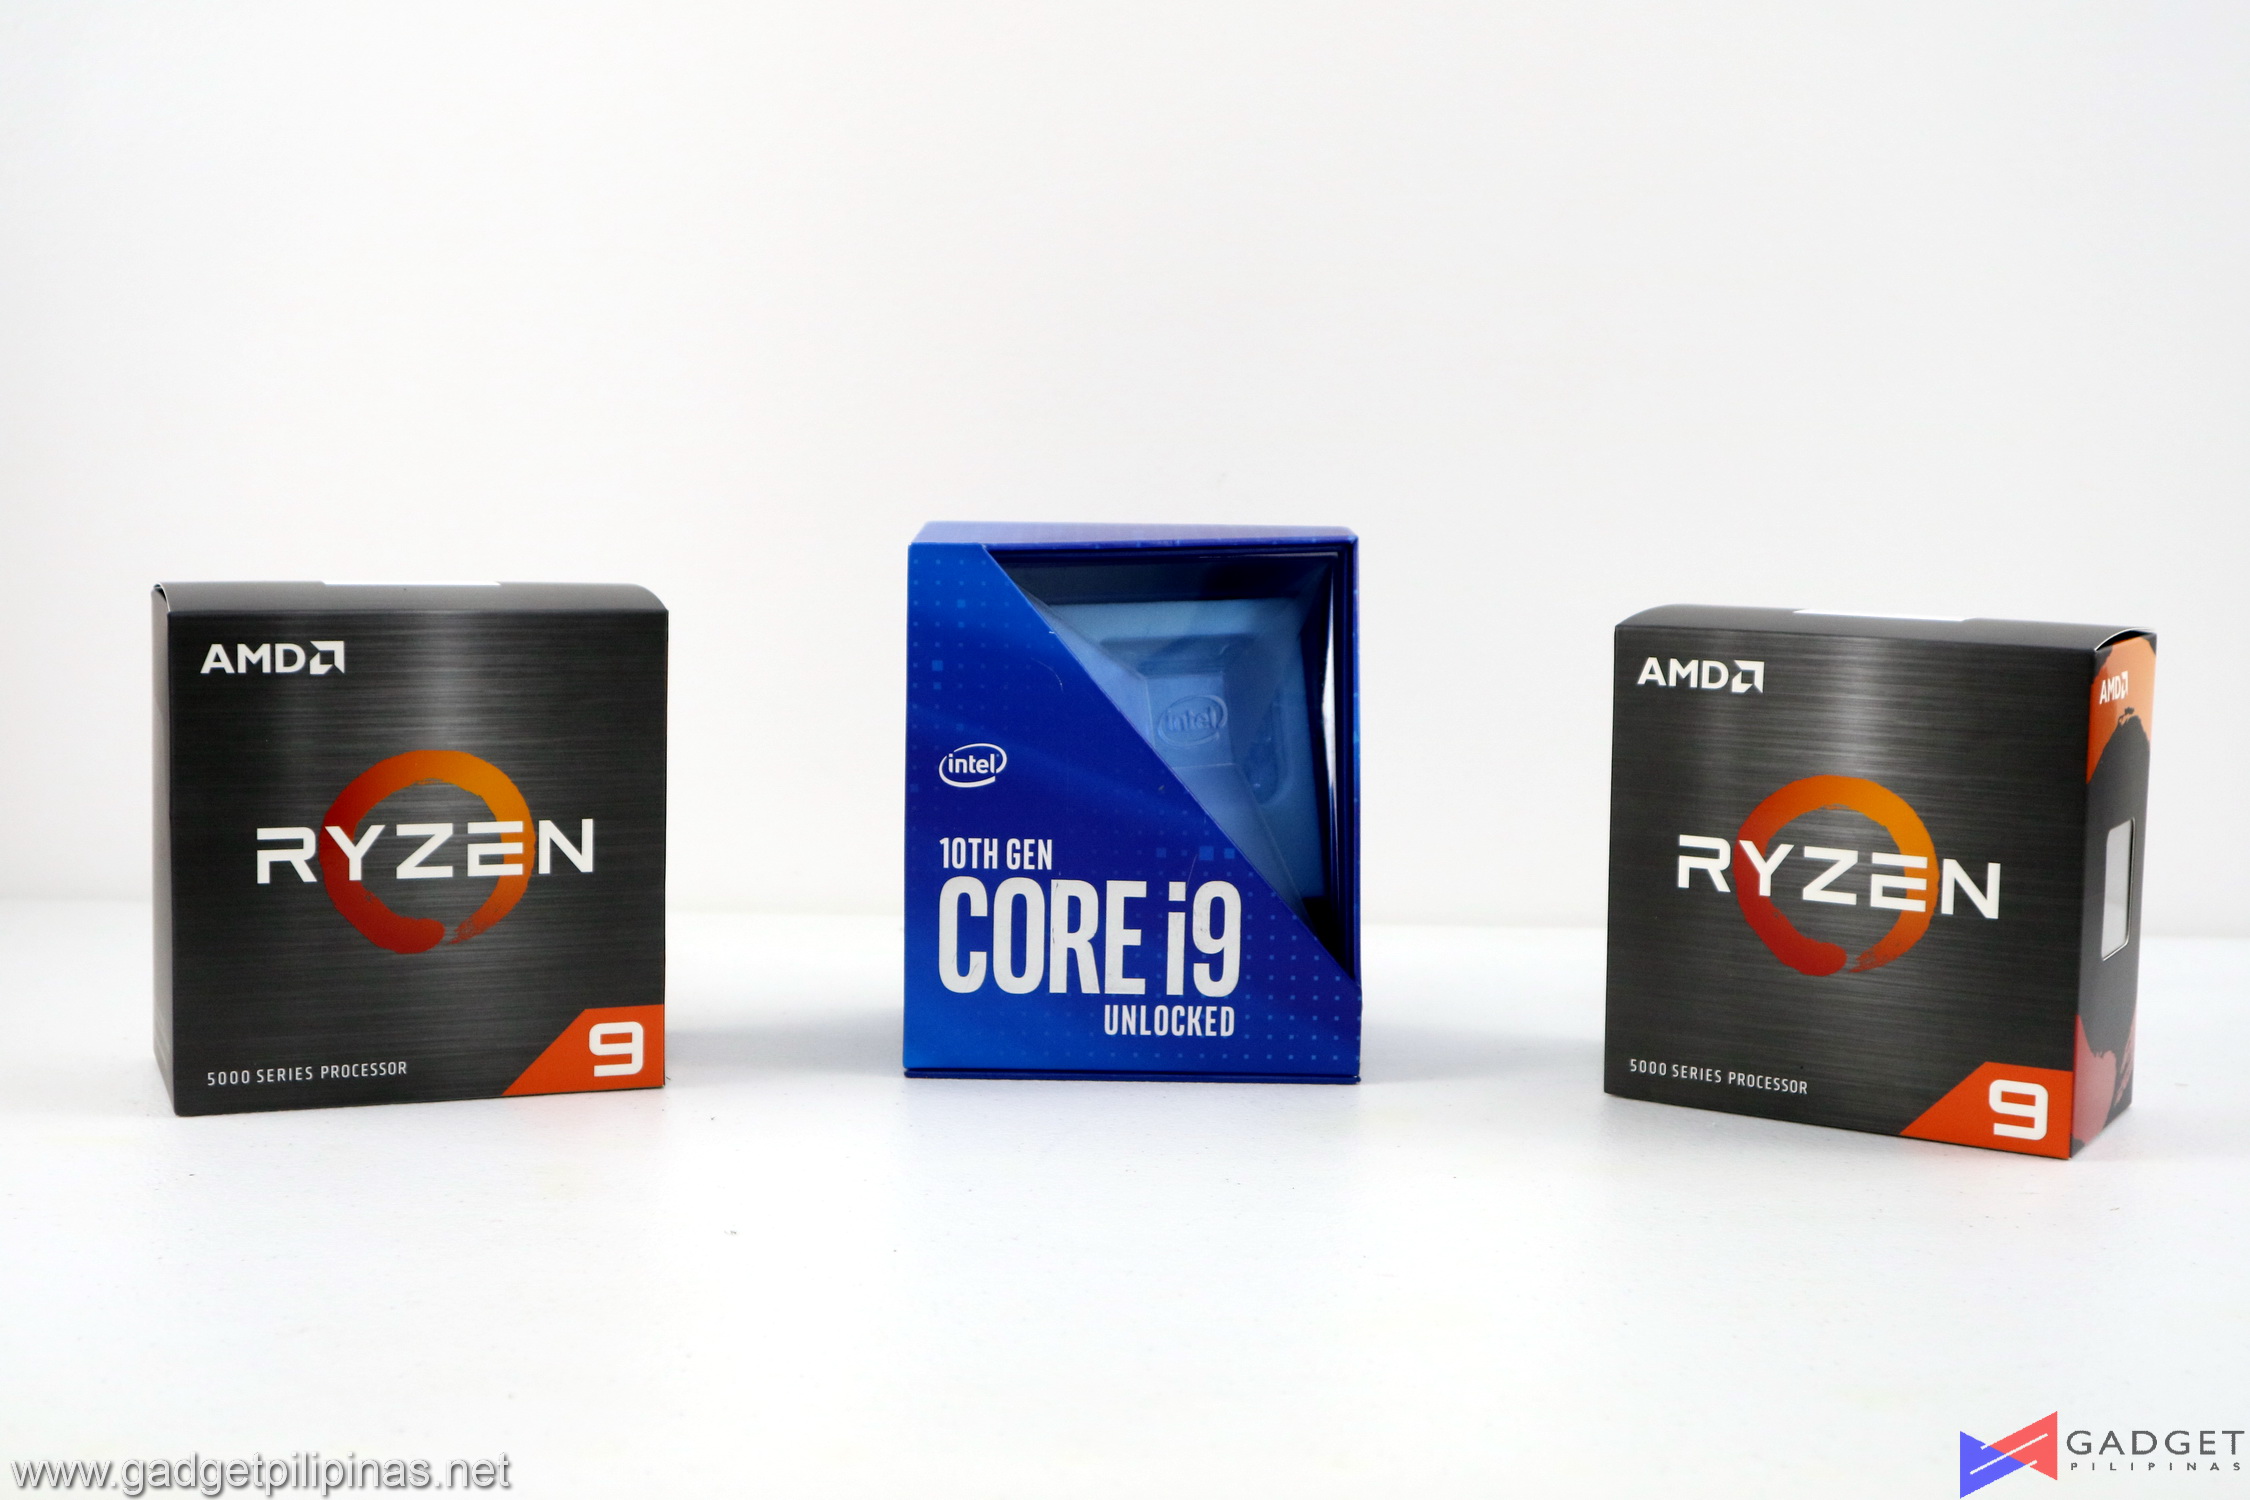 The AMD Ryzen 9 5950X and Ryzen 9 5900X are benchmarked against the Ryzen 9 3900X and Intel’s flagship Core i9 10900K processor. The Ryzen 9 5900X directly clashes with the Intel i9 10900k in terms of pricing, while the Ryzen 9 5950X sits at a higher price tier and thus will be evaluated as an “upgrade” for both the 5900X and 10900k. We skipped benchmarking the Intel Core i7 10700K as it is reserved for our upcoming Ryzen 7 3800XT review.
Gadget Pilipinas’ testing philosophy is to provide detail-oriented results as accurately as possible that our readers can replicate our tests given that these conditions are met. Different benchmarking apps and sequences are used depending on the component or device being tested.
| AMD Ryzen 9 5950X Review Test Bench Specs | ||||
| CPU | Intel Core i7 10900K | AMD Ryzen 9 5950X | AMD Ryzen 9 5900X | AMD Ryzen 9 3900X |
| COOLER | Corsair H100i RGB PRO XT 240mm AIO – Noctua NT-H2 Thermal Paste | |||
| MOTHERBOARD | ASUS ROG Strix Z490-E Gaming Motherboard | ASUS ROG Crosshair VIII Hero (Wi-Fi) | ||
| MEMORY | TForce XTREEM ARGB 16GB(2x8GB) 3600Mhz DDR4 | |||
| GPU | Inno3D GeForce RTX 3070 iChill X4 8GB (457.09 Drivers) | |||
| STORAGE | TForce CARDEA Liquid NVMe SSD | |||
| POWERSUPPLY | ThermalTake ToughPower 1200w Platinum | |||
| OPERATING SYSTEM | Windows 10 Pro Build 2404 | |||
| DISPLAY | Lenovo Legion Y27Q Gaming Monitor | |||
We use CapFrameX 1.5.7 Beta as our FPS capture and analysis tool for all our gaming benchmarks. The latest build version of Windows 10 and WHQL certified drivers are used for our benchmarks. Readings such as temperatures and power draw are recorded using HWMonitor, HWInfo64, and other relevant software for cross-checking.
Benchmark list
- SuperPi 32M
- wPrime
- AIDA64 Memory Benchmark
- Geekbench 5
- Cinebench R20
- Google Octane
- V-Ray
- HWBot x265
- Handbrake
- Blender
- Corona Renderer
- 3DMark
- DOTA 2
- Rainbow Six Siege
- Metro Exodus
- Far Cry 5
- Shadow of the Tomb Raider
- GTA V
- F1 2020
- Battlefield V
- Assassins Creed: Odyssey
- Anno 1800
Our benchmark list and methodology may change in the future, depending on the industry trend.
AMD Ryzen 9 5950X CPU Benchmarks
SuperPI 32M
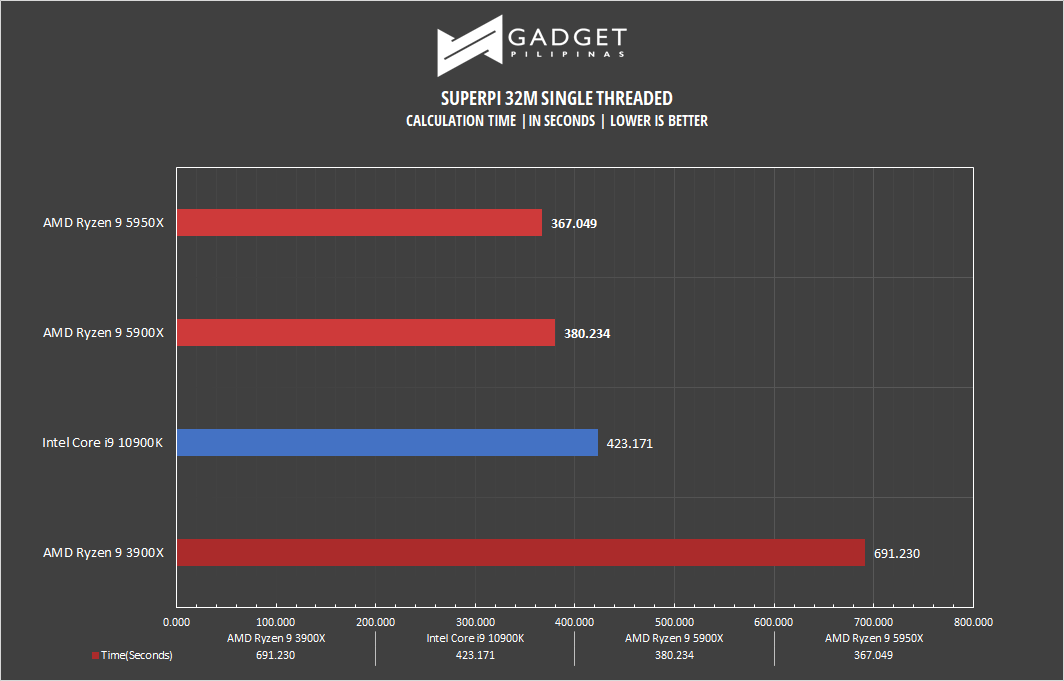 SuperPI is a single-threaded benchmark application that lets the CPU calculate Pi(π) to the nth digit. In this benchmark, we selected the Pi calculation to 32M, the highest available for the app.
wPrime 1024M
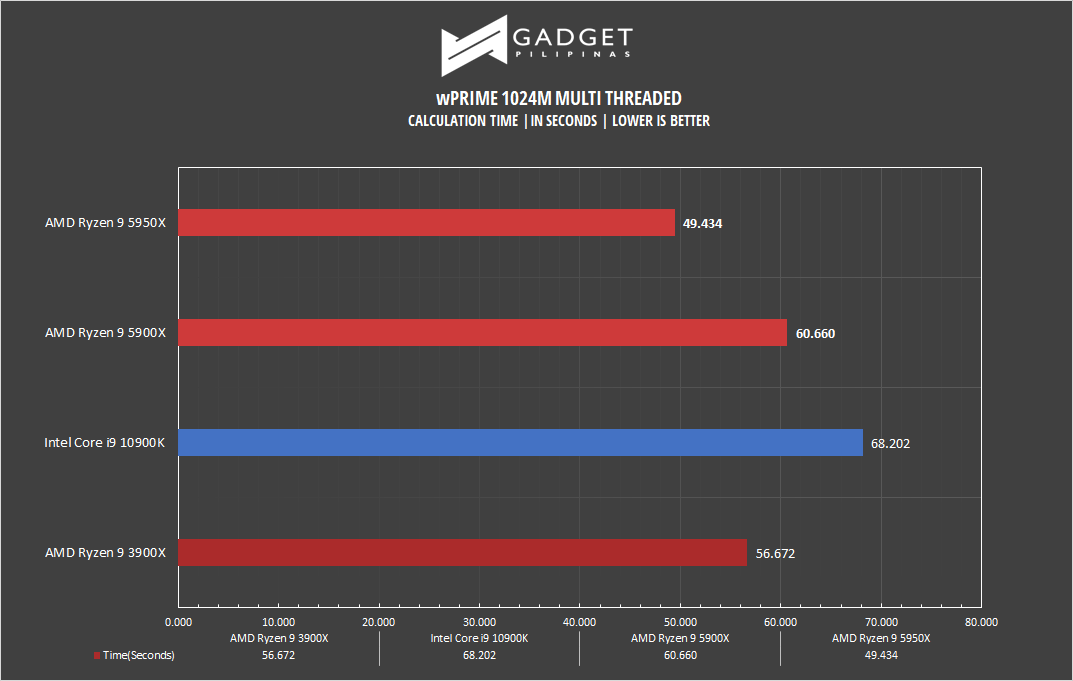 wPrime is a benchmark tool similar to SuperPI, but the former takes on finding prime numbers using Newton’s Method. The benchmark is set to calculate 1024 million prime numbers, and the performance is measured according to calculation time.
AIDA64 Memory Benchmark
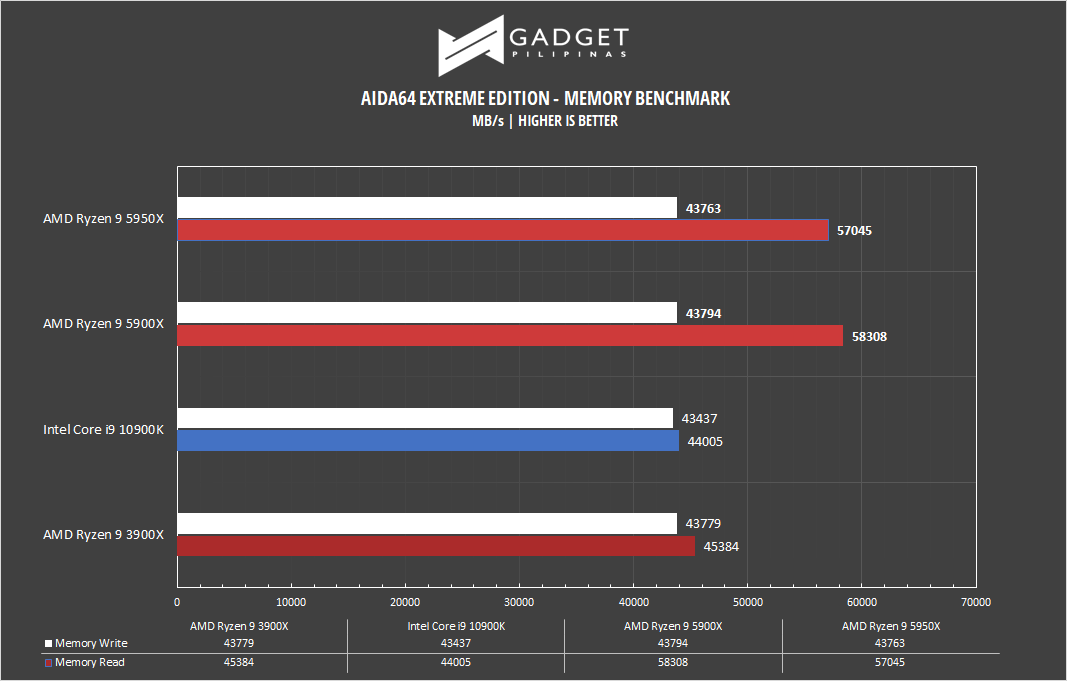 AIDA64 is a very popular and powerful monitoring tool, as well as a benchmarking application. AIDA64 is commonly used to stress test CPUs, especially testing if an overclock is stable. We used AIDA64’s Memory Benchmark to measure the data transfer bandwidth of the system memory.
GeekBench 5
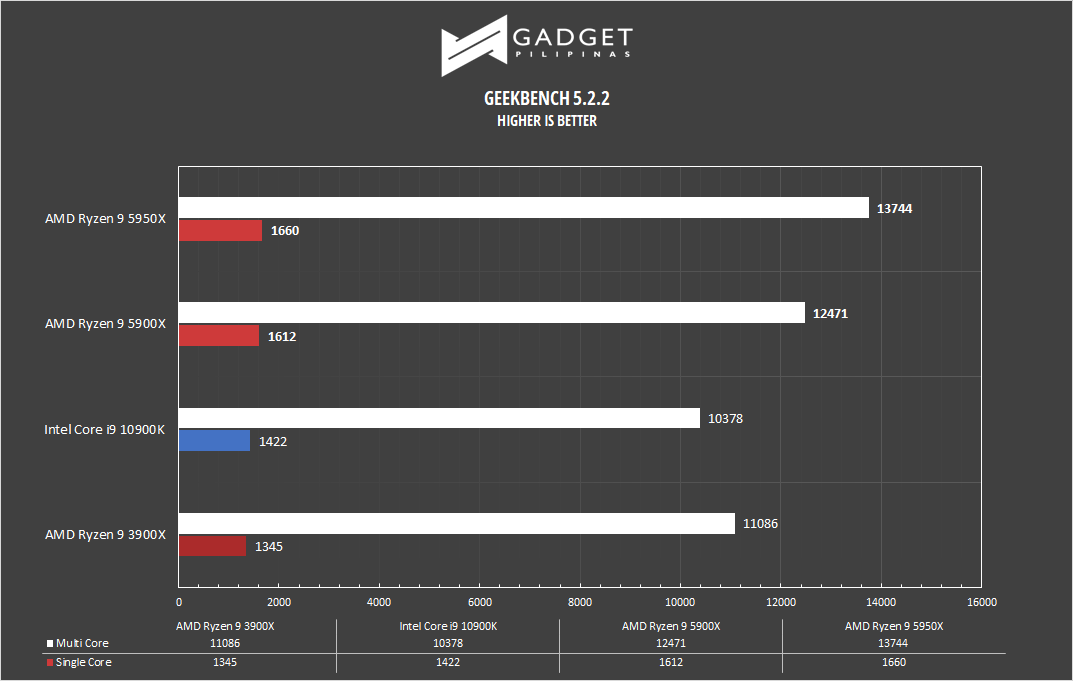 Geekbench is a multi-platform benchmark used to gauge CPU performance and compare them across Windows, Mac, and Mobile. Geekbench 5 is the latest version and doesn’t rely on memory than the previous Geekbench 4, making it a great tool to measure both single-core and multi-core CPU performance.
CINEBENCH R20
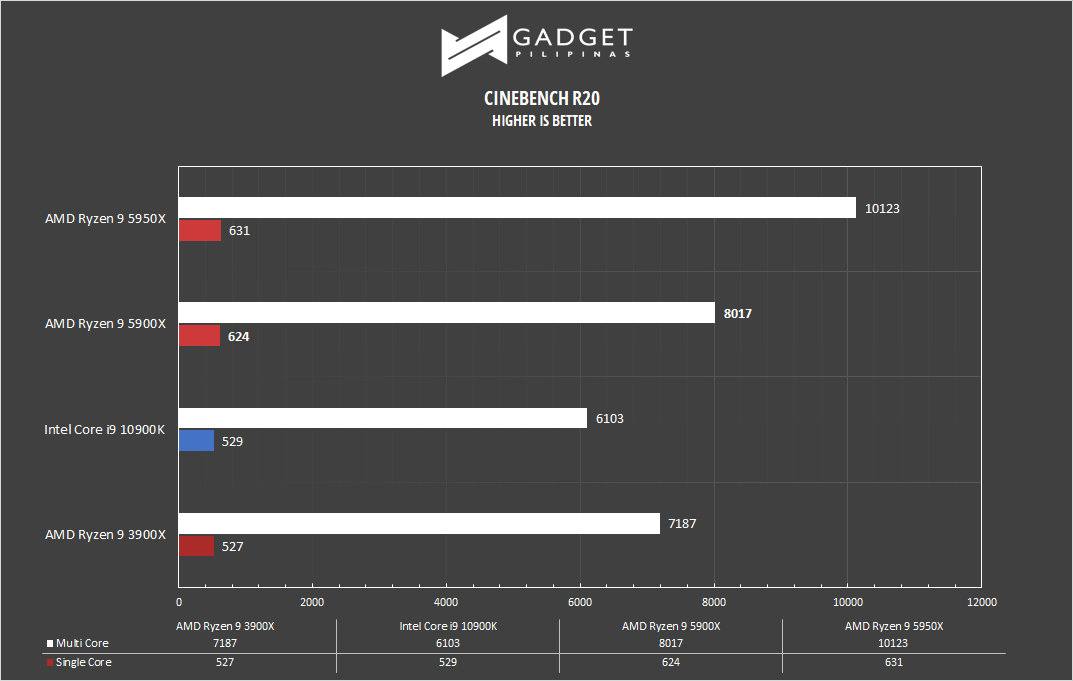 Maxon’s Cinebench benchmark is one of the most iconic benchmark applications used by reviewers and enthusiasts. The latest Cinebench R20 uses the latest rendering architectures, including Intel’s Embree ray tracing technology and other advanced features from AMD and Intel that allows users to render the same scene on the same hard. Cinebench R20 uses a larger and more complex testing scene than Cinebench R20 by about 8x computational power and requires 4x the memory.
GOOGLE OCTANE 2.0
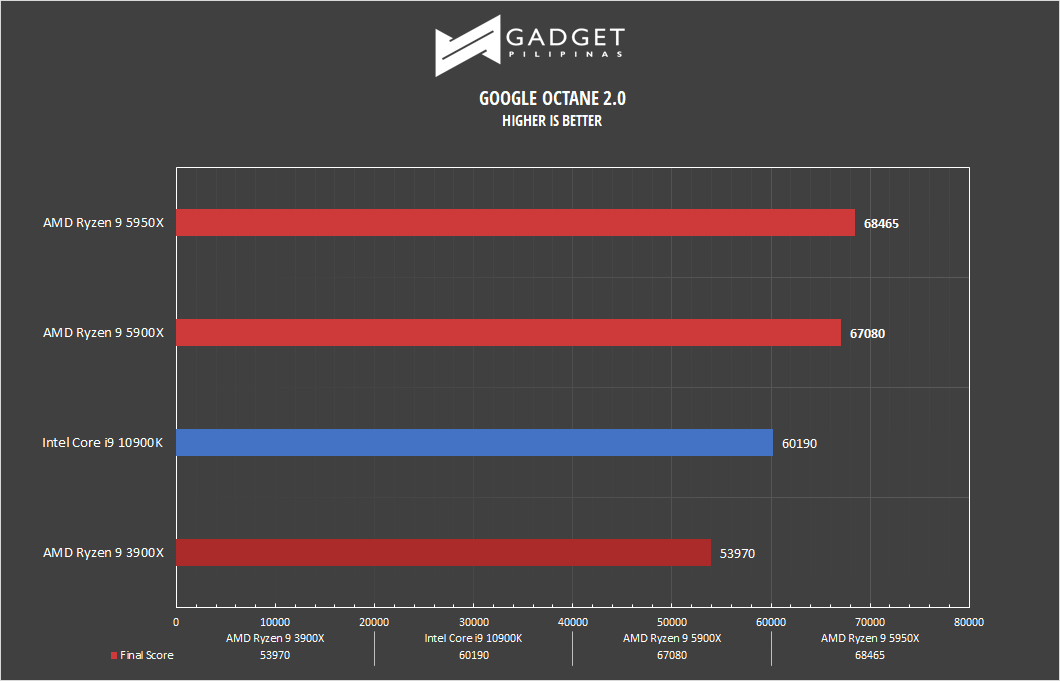 Google Octane 2.0 is a benchmark that measures a Javascript engine’s performance by running multiple tests representing different use cases of JavaScript applications. While Google Octane is retired and no longer maintained, it is still a good representation of today’s dynamic, interactive web applications. Our Google Octane 2.0 is run on Microsoft’s latest Chromium-based Edge browser.
V-RAY
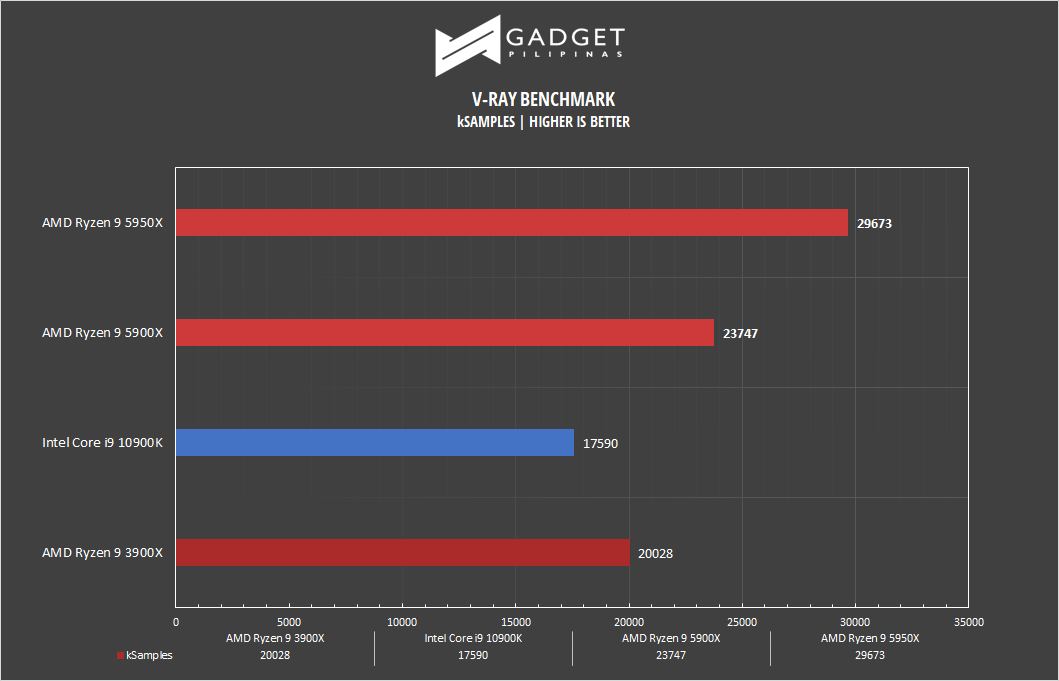 V-Ray Benchmark is a stand-alone version V-Ray developed by Chaos Group. It is designed to test the CPU and GPU by rendering sample scenes at a fixed amount of time. V-Ray is a plug-in mostly utilized by 3D computer graphics software applications mainly for industrial design, product design, architecture, film, and video game production. V-Ray is not limited to 64-threads as it supports multi and mega threading.
HWBOT x265
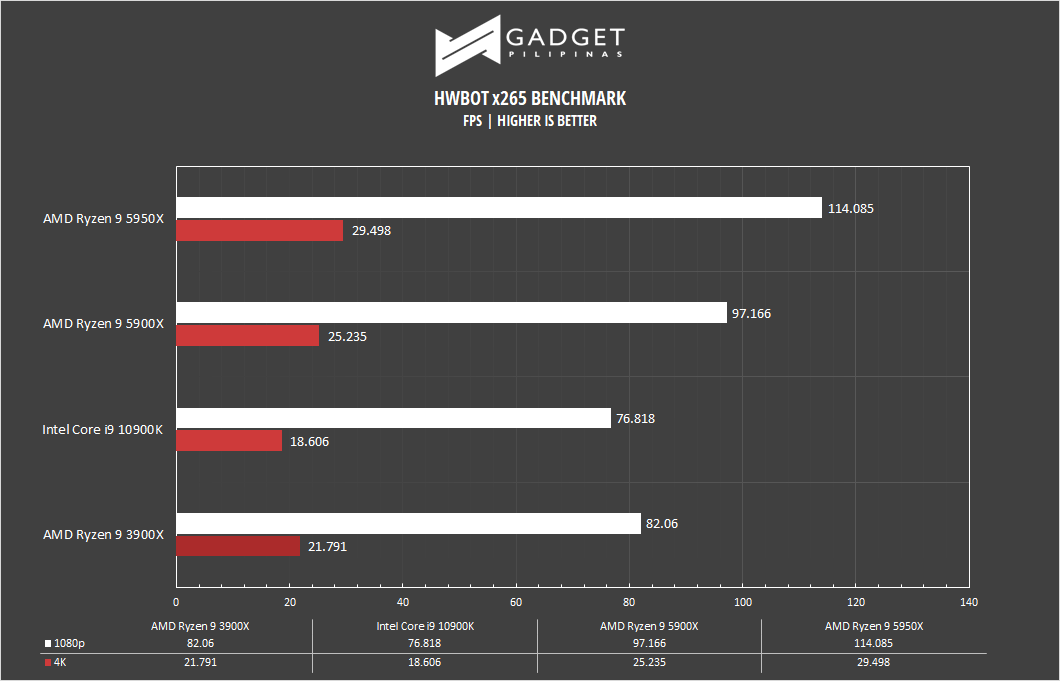 HWBOT x265, developed by Czech overclocker Havli, is a multi-threaded application that takes advantage of modern CPU instruction sets with support for older CPUs. HWBOT x265 benchmark uses the x265/HEVC encoder that renders a video in 1080p or 4K resolution.
HANDBRAKE
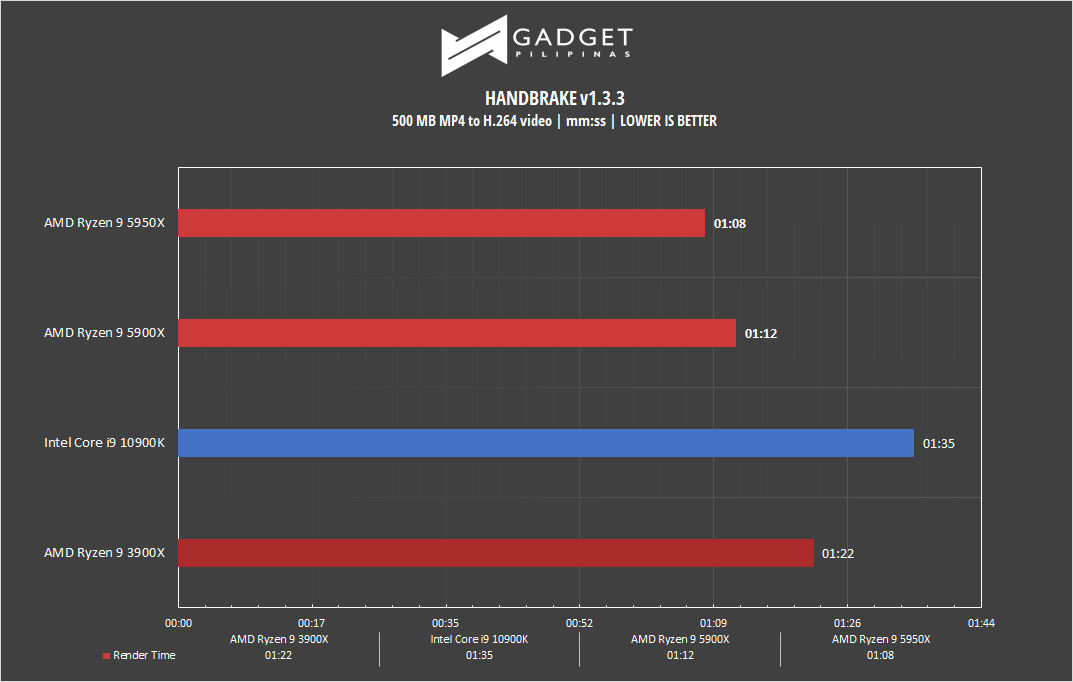 Handbrake is a top-rated open-source video conversion software that is used by professionals, enthusiasts, and even reviewers as a reference point mainly because of its wide variety of media codecs. The rise of streaming and blogging makes video content, both encoding, and transcoding important for these people, regardless if they’re seasoned professionals or just starting out. Handbrake also takes advantage of AVX-512 and OpenCL to accelerate certain types of media codecs. Our Handbrake benchmark converts a 500MB MP4 video to H.264 to measure the processor’s performance.
BLENDER
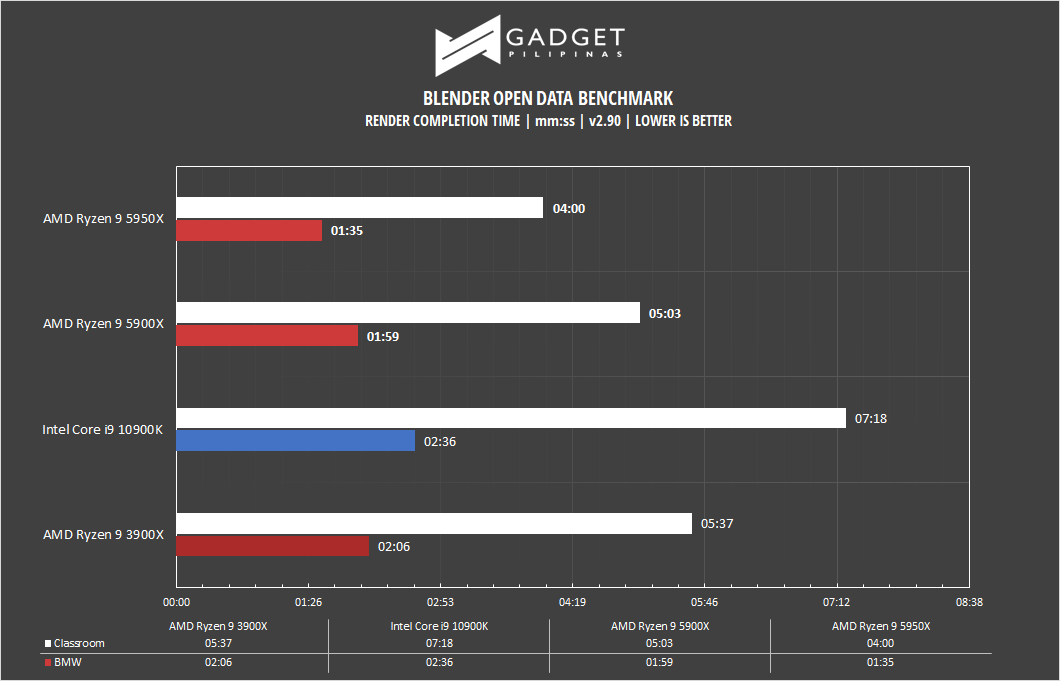 Blender is a widely used, free, opensource 3D creation suite. It supports the whole 3D pipeline process from modeling, rigging, animation, simulation, rendering, and even motion tracking. Blender has become a standard for CPU benchmarks with the BMW27 and Classroom scene most used. This prompted the company to release Blender Open Data Benchmark in 2018, a benchmark-specific version which allows users to run a preset benchmark and share the results online similar to 3D Mark.
CORONA RENDERER
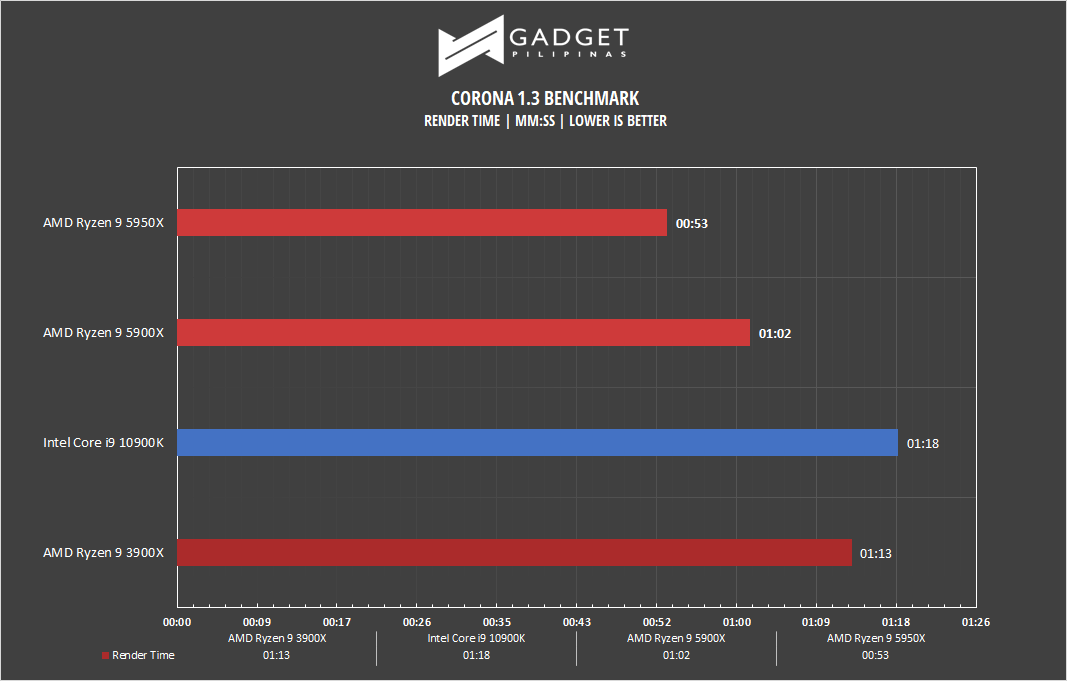 Corona Renderer is an unbiased photorealistic render available for Autodesk 3Ds Max, Maxon Cinema 4D, and as a stand-alone application. Its popularity, similar to Blender, led Chaos Group to develop a benchmark version of the app which runs using Corona Renderer 1.3. Workstation systems, especially CPUs, can utilize Corona Benchmark as up to 72 threads can be used in the benchmark, making it very suitable for CPUs with various price segments.
PCMark10
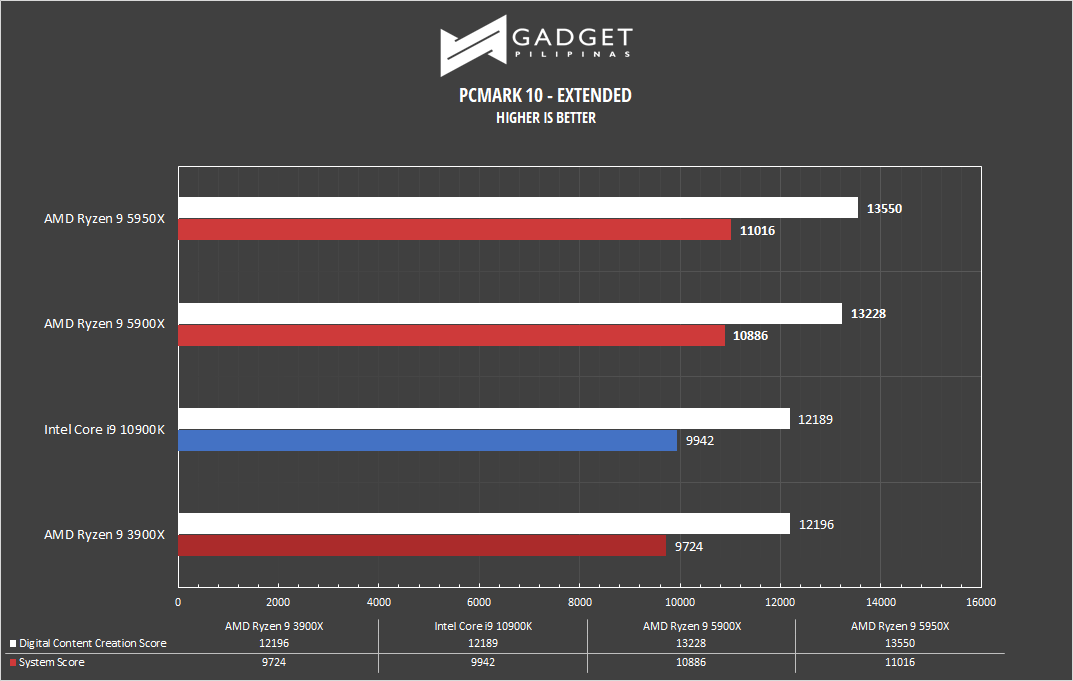 From the same developers of the popular game benchmarking tool 3DMark, PCMark 10 is a benchmarking app for measure a whole PC’s performance. It covers a wide variety of tests to reflect common tasks performed in a modern workplace. We selected PCMark 10’s extended benchmark and reported both the overall score and Digital Content Creation Score.
AMD Ryzen 9 5950X Gaming Benchmarks
3DMARK
- AMD Ryzen 9 5950X Review 3DMark Firestrike Benchmark
- AMD Ryzen 9 5950X Review 3DMark Firestrike Benchmark
- AMD Ryzen 9 5950X Review 3DMark TimeSpy Benchmark
- AMD Ryzen 9 5950X Review 3DMark TimeSpy Benchmark
3DMark is the go-to benchmark for gamers because of the ability to share and compare results online. We used Time Spy DirectX 12 benchmark and Fire Strike DirectX 11 benchmark to gauge the CPU’s performance using different APIs.
DOTA 2
- AMD Ryzen 9 5950X Review DOTA 2 Benchmark 1080p
- AMD Ryzen 9 5950X Review DOTA 2 Benchmark 1080p
- AMD Ryzen 9 5950X Review DOTA 2 Benchmark 1080p Frametimes
- AMD Ryzen 9 5950X Review DOTA 2 Benchmark 1080p Frametimes
- AMD Ryzen 9 5950X Review DOTA 2 Benchmark 1440p
- AMD Ryzen 9 5950X Review DOTA 2 Benchmark 1440p
- AMD Ryzen 9 5950X Review DOTA 2 Benchmark 1440p Frametimes
- AMD Ryzen 9 5950X Review DOTA 2 Benchmark 1440p Frametimes
- AMD Ryzen 9 5950X Review DOTA 2 Benchmark 4K
- AMD Ryzen 9 5950X Review DOTA 2 Benchmark 4K
- AMD Ryzen 9 5950X Review DOTA 2 Benchmark 4K Frametimes
- AMD Ryzen 9 5950X Review DOTA 2 Benchmark 4K Frametimes
Most gamers play at least one of the following free-to-play titles: League of Legends, CS: GO, Dota 2, and/or Fortnite. Dota 2 is a good representation of the F2P titles as it is the most demanding game in the spectrum. The benchmark will give you an idea of the laptop’s relative performance on other lesser demanding titles. Our benchmark sequence is based on a replay of OG vs. Liquid in the TI9 grand finals from the team fight that happened on 28:30 to 29:30.
Far Cry 5
- AMD Ryzen 9 5950X Review Far Cry 5 Benchmark 1080p
- AMD Ryzen 9 5950X Review Far Cry 5 Benchmark 1080p
- AMD Ryzen 9 5950X Review Far Cry 5 Benchmark 1080p Frametimes
- AMD Ryzen 9 5950X Review Far Cry 5 Benchmark 1080p Frametimes
- AMD Ryzen 9 5950X Review Far Cry 5 Benchmark 1440p
- AMD Ryzen 9 5950X Review Far Cry 5 Benchmark 1440p
- AMD Ryzen 9 5950X Review Far Cry 5 Benchmark 1440p Frametimes
- AMD Ryzen 9 5950X Review Far Cry 5 Benchmark 1440p Frametimes
- AMD Ryzen 9 5950X Review Far Cry 5 Benchmark 4K
- AMD Ryzen 9 5950X Review Far Cry 5 Benchmark 4K
- AMD Ryzen 9 5950X Review Far Cry 5 Benchmark 4K Frametimes
- AMD Ryzen 9 5950X Review Far Cry 5 Benchmark 4K Frametimes
FarCry 5 is an FPS game published by Ubisoft and uses the Dunia engine. It heavily relies on and takes advantage of DirectX 11 to render a realistic environment that makes it taxing to both the CPU and GPU.
Rainbow Six Siege
- AMD Ryzen 9 5950X Review Rainbow Six Siege Benchmark 1080p
- AMD Ryzen 9 5950X Review Rainbow Six Siege Benchmark 1080p
- AMD Ryzen 9 5950X Review Rainbow Six Siege Benchmark 1080p Frametimes
- AMD Ryzen 9 5950X Review Rainbow Six Siege Benchmark 1080p Frametimes
- AMD Ryzen 9 5950X Review Rainbow Six Siege Benchmark 1440p
- AMD Ryzen 9 5950X Review Rainbow Six Siege Benchmark 1440p
- AMD Ryzen 9 5950X Review Rainbow Six Siege Benchmark 1440p Frametimes
- AMD Ryzen 9 5950X Review Rainbow Six Siege Benchmark 1440p Frametimes
- AMD Ryzen 9 5950X Review Rainbow Six Siege Benchmark 4k
- AMD Ryzen 9 5950X Review Rainbow Six Siege Benchmark 4k
- AMD Ryzen 9 5950X Review Rainbow Six Siege Benchmark 4k Frametimes
- AMD Ryzen 9 5950X Review Rainbow Six Siege Benchmark 4k Frametimes
Rainbow Six Seige is one of the few popular AAA games that’s still popular in 2019 due to its competitive gameplay mechanics. R6S uses the AnvilNext game engine, which is developed by the game’s publisher, Ubisoft. As of writing, Rainbow Six Siege is currently the most popular Tom Clancy title beating out Wildlands, Breakpoint and even, Division 2.
GTA V
- AMD Ryzen 9 5950X Review GTA V Benchmark 1080p
- AMD Ryzen 9 5950X Review GTA V Benchmark 1080p
- AMD Ryzen 9 5950X Review GTA V Benchmark 1080p Frametimes
- AMD Ryzen 9 5950X Review GTA V Benchmark 1080p Frametimes
- AMD Ryzen 9 5950X Review GTA V Benchmark 1440p
- AMD Ryzen 9 5950X Review GTA V Benchmark 1440p
- AMD Ryzen 9 5950X Review GTA V Benchmark 1440p Frametimes
- AMD Ryzen 9 5950X Review GTA V Benchmark 1440p Frametimes
- AMD Ryzen 9 5950X Review GTA V Benchmark 4k
- AMD Ryzen 9 5950X Review GTA V Benchmark 4k
- AMD Ryzen 9 5950X Review GTA V Benchmark 4k Frametimes
- AMD Ryzen 9 5950X Review GTA V Benchmark 4k Frametimes
Grand Theft Auto is undoubtedly one of the most iconic installments in the gaming industry. Released on September 13, GTA V still tops Steam’s most-played games chart thanks to the immersive open-world mechanics, modding support, and role-playing multiplayer servers.
Battlefield V
- AMD Ryzen 9 5950X Review Battlefield V Benchmark 1080p
- AMD Ryzen 9 5950X Review Battlefield V Benchmark 1080p
- AMD Ryzen 9 5950X Review Battlefield V Benchmark 1080p Frametimes
- AMD Ryzen 9 5950X Review Battlefield V Benchmark 1080p Frametimes
- AMD Ryzen 9 5950X Review Battlefield V Benchmark 1440p
- AMD Ryzen 9 5950X Review Battlefield V Benchmark 1440p
- AMD Ryzen 9 5950X Review Battlefield V Benchmark 1440p Frametimes
- AMD Ryzen 9 5950X Review Battlefield V Benchmark 1440p Frametimes
- AMD Ryzen 9 5950X Review Battlefield V Benchmark 4K
- AMD Ryzen 9 5950X Review Battlefield V Benchmark 4K
- AMD Ryzen 9 5950X Review Battlefield V Benchmark 4K Frametimes
- AMD Ryzen 9 5950X Review Battlefield V Benchmark 4K Frametimes
Shadow of The Tomb Raider
- AMD Ryzen 9 5950X Review SOTR Benchmark 1080p
- AMD Ryzen 9 5950X Review SOTR Benchmark 1080p
- AMD Ryzen 9 5950X Review SOTR Benchmark 1080p Frametimes
- AMD Ryzen 9 5950X Review SOTR Benchmark 1080p Frametimes
- AMD Ryzen 9 5950X Review SOTR Benchmark 1440p
- AMD Ryzen 9 5950X Review SOTR Benchmark 1440p
- AMD Ryzen 9 5950X Review SOTR Benchmark 1440p Frametimes
- AMD Ryzen 9 5950X Review SOTR Benchmark 1440p Frametimes
- AMD Ryzen 9 5950X Review SOTR Benchmark 4K
- AMD Ryzen 9 5950X Review SOTR Benchmark 4K
- AMD Ryzen 9 5950X Review SOTR Benchmark 4K Frametimes
- AMD Ryzen 9 5950X Review SOTR Benchmark 4K Frametimes
Shadow of The Tomb Raider or SOTR is the latest installment of the Lara Croft Tomb Raider franchise. Developed by Square Enix, SOTR uses the Foundation engine and is further enhanced by Eidos Montreal. STOR is also one of the first games to come out with Ray Tracing and DLSS support.
Metro Exodus
- AMD Ryzen 9 5950X Review Metro Exodus Benchmark 1080p
- AMD Ryzen 9 5950X Review Metro Exodus Benchmark 1080p
- AMD Ryzen 9 5950X Review Metro Exodus Benchmark 1080p Frametimes
- AMD Ryzen 9 5950X Review Metro Exodus Benchmark 1080p Frametimes
- AMD Ryzen 9 5950X Review Metro Exodus Benchmark 1440p
- AMD Ryzen 9 5950X Review Metro Exodus Benchmark 1440p
- AMD Ryzen 9 5950X Review Metro Exodus Benchmark 1440p Frametimes
- AMD Ryzen 9 5950X Review Metro Exodus Benchmark 1440p Frametimes
- AMD Ryzen 9 5950X Review Metro Exodus Benchmark 4k
- AMD Ryzen 9 5950X Review Metro Exodus Benchmark 4k
- AMD Ryzen 9 5950X Review Metro Exodus Benchmark 4k Frametimes
- AMD Ryzen 9 5950X Review Metro Exodus Benchmark 4k Frametimes
Metro Exodus is the third Metro game trilogy based on Dmitry Glukhovsky’s novels. The game is a first-person shooter with survival horror and stealth elements. The post-apocalyptic game is using 4A Engine by 4A games. Released last 2019, Metro Exodus remains to be one of the most graphically pleasing and demanding games that’s popular to date.
Assassin’s Creed: Odyssey
- AMD Ryzen 9 5950X Review Assassins Creed Benchmark 1080p
- AMD Ryzen 9 5950X Review Assassins Creed Benchmark 1080p
- AMD Ryzen 9 5950X Review Assassins Creed Benchmark 1080p Frametimes
- AMD Ryzen 9 5950X Review Assassins Creed Benchmark 1080p Frametimes
- AMD Ryzen 9 5950X Review Assassins Creed Benchmark 1440p
- AMD Ryzen 9 5950X Review Assassins Creed Benchmark 1440p
- AMD Ryzen 9 5950X Review Assassins Creed Benchmark 1440p Frametimes
- AMD Ryzen 9 5950X Review Assassins Creed Benchmark 1440p Frametimes
- AMD Ryzen 9 5950X Review Assassins Creed Benchmark 4k
- AMD Ryzen 9 5950X Review Assassins Creed Benchmark 4k
- AMD Ryzen 9 5950X Review Assassins Creed Benchmark 4k Frametimes
- AMD Ryzen 9 5950X Review Assassins Creed Benchmark 4k Frametimes
Assassin’s Creed Odyssey is the latest franchise installment from Ubisoft. It’s by far the most popular and stable Assassin’s Creed title since AC IV: Black Flag. It uses the AnvilNext 2.0 game engine, an updated version of Rainbow Six Siege’s game engine, and uses the DirectX 12 API.
F1 2020
- AMD Ryzen 9 5950X Review F1 2020 Benchmark 1080p
- AMD Ryzen 9 5950X Review F1 2020 Benchmark 1080p
- AMD Ryzen 9 5950X Review F1 2020 Benchmark 1080p Frametimes
- AMD Ryzen 9 5950X Review F1 2020 Benchmark 1080p Frametimes
- AMD Ryzen 9 5950X Review F1 2020 Benchmark 1440p
- AMD Ryzen 9 5950X Review F1 2020 Benchmark 1440p
- AMD Ryzen 9 5950X Review F1 2020 Benchmark 1440p frametimes
- AMD Ryzen 9 5950X Review F1 2020 Benchmark 1440p frametimes
- AMD Ryzen 9 5950X Review F1 2020 Benchmark 4K
- AMD Ryzen 9 5950X Review F1 2020 Benchmark 4K
- AMD Ryzen 9 5950X Review F1 2020 Benchmark 4K Frametimes
- AMD Ryzen 9 5950X Review F1 2020 Benchmark 4K Frametimes
F1 2020 is the official video game of the 2020 Formula 1 and Formula 2 championships developed by Codemasters. F1 2020 is the twelfth installment in the franchise and uses the Ego Engine 3.0. F1 2020 is a good representation of racing games thanks to its realistic graphics and fairly demanding spec requirements.
Anno 1800
- AMD Ryzen 9 5950X Review Anno 1800 Benchmark 1080p
- AMD Ryzen 9 5950X Review Anno 1800 Benchmark 1080p
- AMD Ryzen 9 5950X Review Anno 1800 Benchmark 1080p Frametimes
- AMD Ryzen 9 5950X Review Anno 1800 Benchmark 1080p Frametimes
- AMD Ryzen 9 5950X Review Anno 1800 Benchmark 1440p
- AMD Ryzen 9 5950X Review Anno 1800 Benchmark 1440p
- AMD Ryzen 9 5950X Review Anno 1800 Benchmark 1440p Frametimes
- AMD Ryzen 9 5950X Review Anno 1800 Benchmark 1440p Frametimes
- AMD Ryzen 9 5950X Review Anno 1800 Benchmark 4K
- AMD Ryzen 9 5950X Review Anno 1800 Benchmark 4K
- AMD Ryzen 9 5950X Review Anno 1800 Benchmark 4K Frametimes
- AMD Ryzen 9 5950X Review Anno 1800 Benchmark 4K Frametimes
Anno 1800 is one of the most popular RTS games next to seasoned classics such as StarCraft 2, Red Alert, and Civilization V. Anno 1800 uses an improved Anno Engine version previously used by previous titles. It’s one of the latest RTS games (as of writing) with impressive graphics, making it a great representation for RTS and City-building games.
Temperatures
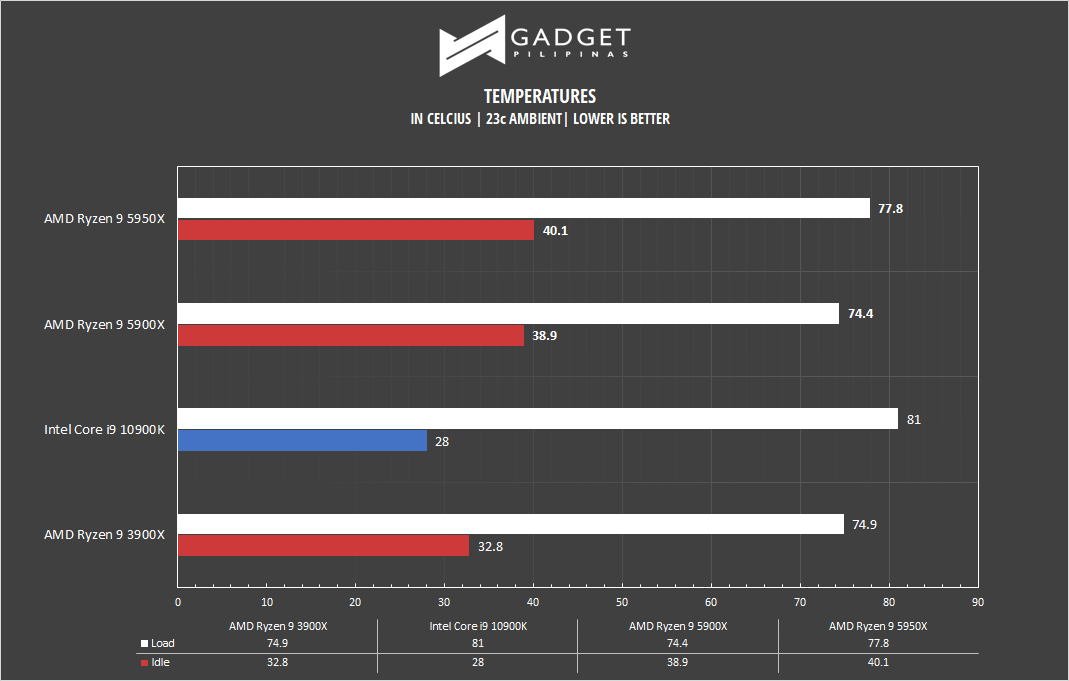
We honestly expected the AMD’s Ryzen 5000 series to run hot but we were gladly wrong. It’s given that both Ryzen 9 processors run hotter on idle versus the 10900K due to having more physical cores. What’s impressive is the maximum temps we recorded during our whole benchmark session with the Ryzen 9 5950X only hitting 77.8°C max temps.
Performance Summary and Conclusion
Whether it be encoding, arithmetic, rendering, or content creation, the Ryzen 9 5950X easily dominates in both single-core and multi-core workloads. The Ryzen 9 5950X is about 15% faster on single-core and as much as 60% faster in multithreaded tasks versus Intel’s flagship 10900k CPU.
- AMD Ryzen 9 5950X Review 1080p gaming performance
- AMD Ryzen 9 5950X Review 1080p gaming performance
- AMD Ryzen 9 5950X Review 1440p gaming performance
- AMD Ryzen 9 5950X Review 1440p gaming performance
- AMD Ryzen 9 5950X Review 4k gaming performance
- AMD Ryzen 9 5950X Review 4k gaming performance
The AMD Ryzen 9 5950X continues its lead over the 10900K even in gaming. Across ten benchmarked games, the Ryzen 9 5950X comes out on top even in various resolutions. Do note that we used an RTX 3070 for this review, which translated to minimal scaling on higher resolutions. Regardless, the difference is still clear to conclude that the Ryzen 9 5950X holds the crown as the best performing mainstream desktop CPU in both gaming and productivity.
AMD Ryzen 9 5950X – A teaser of what’s to come
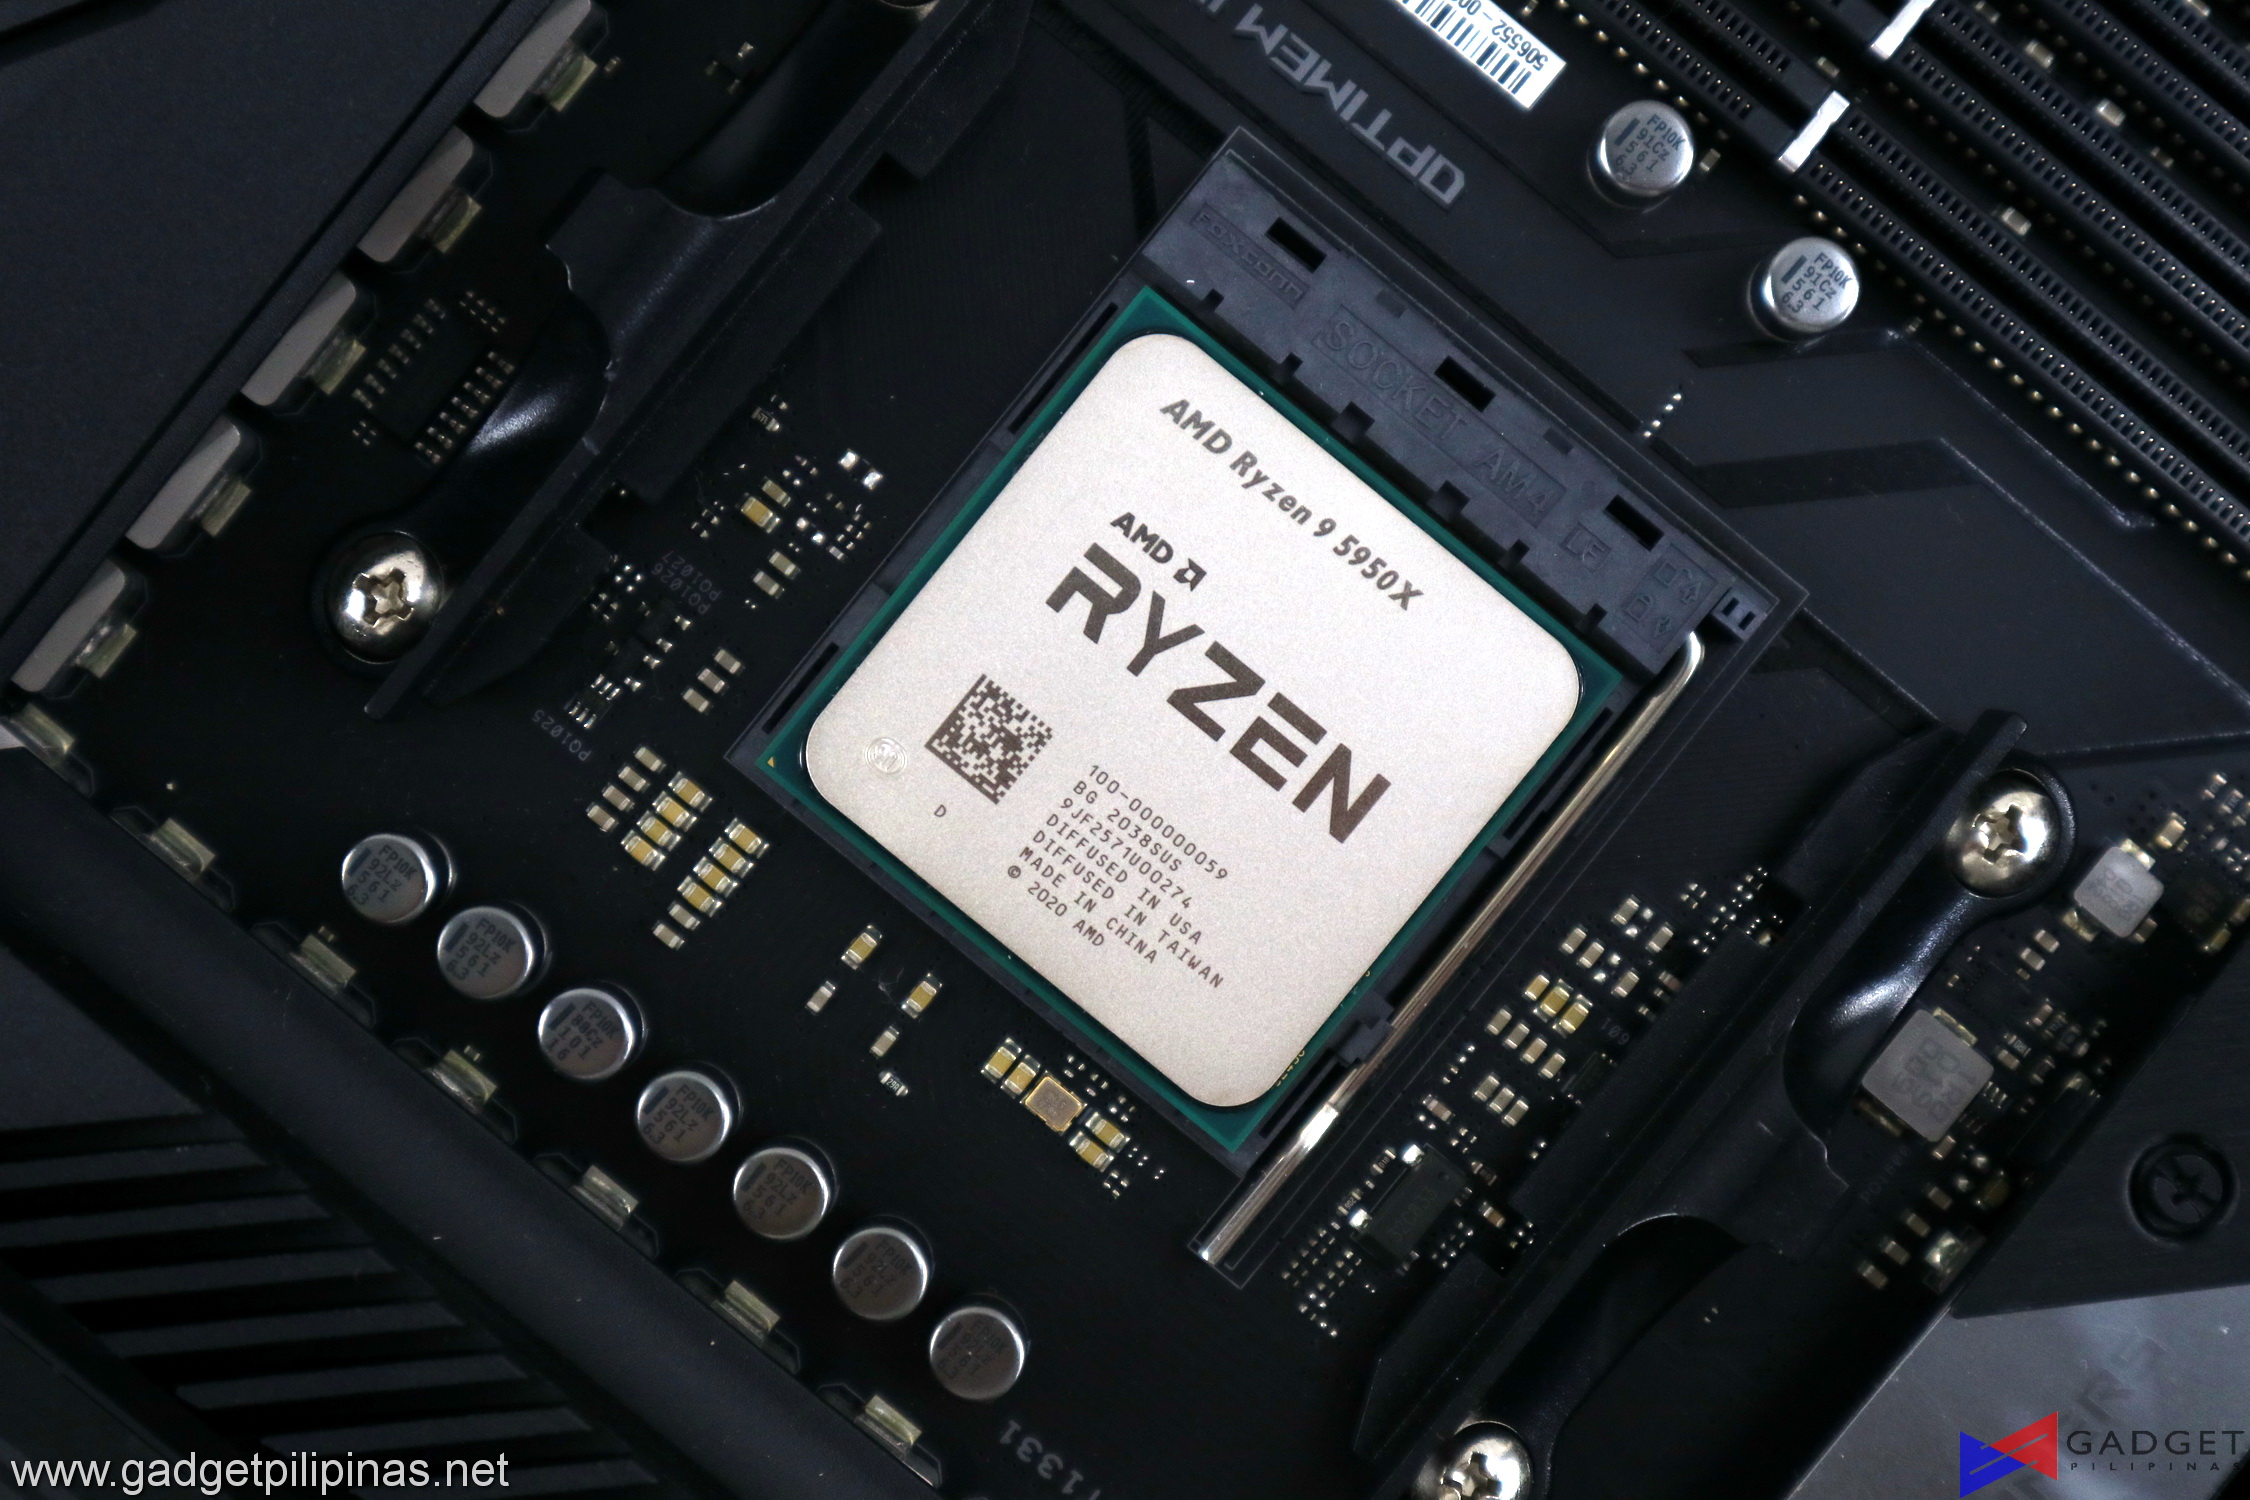 AMD’s Ryzen 9 5950X teases us what AMD has in store for in the future particularly Zen 3 powered Threadrippers and the Zen 4 CPUs under the 5nm lithography, however, it also exposes their path to becoming the ones they swore to destroy. Star Wars reference aside, AMD has produced the fastest gaming and productivity CPU at the cost of its price leadership. The Ryzen 5950X commands a 50% premium over both the Intel i9 10900K and a Php 3,000 price increase over the Ryzen 9 3950X. That said, the Ryzen 9 5950X is the perfect bridge between a mainstream desktop enthusiast-class CPU for gaming and a relatively “budget” HEDT processor for productivity, servers, and workstations.
The AMD Ryzen 9 5950X represents AMD’s hard work and commitment to improving its processors in terms of performance and efficiency. It’s also the brand’s reward to its long-standing fans as the Ryzen 9 5950X is simply the best mainstream desktop CPU in the market, whether it be for gaming or productivity. If you’re an enthusiast looking for the highest gaming performance possible, then look no further than the AMD Ryzen 9 5950X.
Grant is a Financial Management graduate from UST. His passion for gadgets and tech crossed him over in the industry where he could apply his knowledge as an enthusiast and in-depth analytic skills as a Finance Major. His passion allows him to earn at the same time help Gadget Pilipinas' readers in making smart, value-based decisions and purchases with his reviews and guides.

