Reviews can be hard or easy to do depending on the reviewer’s process and benchmark methodology. We look for reviews if we’re interested in a product especially if we’re looking to purchase it with our hard-earned cash. Different reviewers, content creators, and publications have their own testing methods and criteria that they look for on what makes a product “good.” At the end of the day, these reviews should help the reader/viewer decide if the product would fit their needs or would answer for whom the product is for. Like reviewers, the audience also has their own criteria in what to look for in a review – some value the “experiential part” while others would like to look for a scientific data-driven approach aka those with more benchmarks.
At Gadget Pilipinas, we aim for a balance of both without being too technical and burdening the reader with too much data that would only be useful for a handful. In our reviews, we aim to present sufficient data that has more substance than what you would see in a typical review and that’s still digestible even if the reader doesn’t have the technical know-how. So, let’s take a deep dive at our Game Benchmark Methodology and why it matters – even for those who are not “techy.”
Note that in this article we’re mostly referring to CPU and GPU benchmark methodology but the ideology and process are still much applicable to how we do PC Components and Laptop reviews in general.
What is Benchmarking and Why do Reviewers do it?
Benchmarks are a set of systematic tests or measurements used to assess and evaluate a product. Benchmarks allow the readers to get a reference of a product’s performance relative to a certain criterion. The benchmark results are then presented in terms of scores, points, FPS, and any other metric so long as there are numerical data shown. The results can then be compared to other products, preferably those that have some “connection” to the product being reviewed – the most common being price.
For reviewers like us, benchmarks allow us to be objective as it’s a great non-biased way for comparing products. Benchmarks are usually done via testing software or games – the calculations and numbers are done in such a way that reviewers can easily see which products are better. Different benchmarks also measure various aspects of the product which allow us to evaluate a product at a deeper level – the more we know about it, the better our understanding of who are these products for.
Finding The Right Balance – Being Technical and Casual
At Gadget Pilipinas, our benchmark philosophy is being able to provide accurate and detailed benchmark results so that our readers can replicate our test given that these conditions are met. We aim to strike the right balance between being technical and casual, technical in a sense where we’re able to do a scientific approach towards testing while also being digestible to the non-techy person. Our benchmark data mainly serves as proof, reference, or backup whenever we say that something is good or bad and the like. We aim to present verifiable data that is collected without bias or prejudice.
Benchmark Setup and Methodology
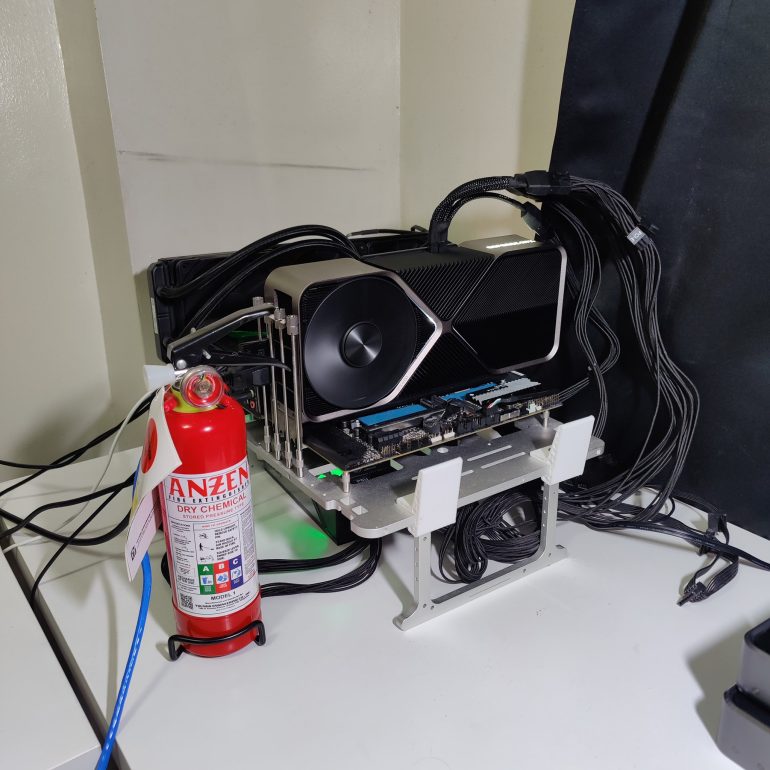
To satisfy both ends of the spectrum, we’ve created a benchmark process that’s simple and replicable to most users should they want to double-check and verify our results. The core of our “verifiable results” is transparency which is what’s disclosed in our reviews. Our testbench setup, software versions, down to the benchmark tools used are shown in each PC Component and laptop review.
Our main FPS benchmarking software of choice is CapFrameX. It’s an all-in-one benchmark tool for data collection, values computation, and graph presentation that’s available for free. Its low API overhead, extensive data set, and availability to the public make it the perfect tool to use as it’s in line with our goal of having transparent, reliable, and repeatable benchmarks.
Before we start our benchmark process, we make sure that we have the latest versions of all relevant software needed for a review – this includes drivers, monitoring software(CapFrameX, HWInfo, etc), firmware, BIOS, and Windows. Once we begin our testing, we temporarily suspend all updates until we’re done with our benchmarks to ensure that each component tested has the exact same configuration from start to finish.
Game Benchmark Selection
Before we go into our actual benchmark methodology, let’s go over how we choose the games for our benchmark suite, in-game settings, and game scenarios. In order to comprehensively evaluate a PC Component or Laptop, we test games with different game engines and genres including but not limited to MOBAs, FPS, MMOs, RPGs, RTS, Racing, and Simulation. Different game genres produce a different kind of workload to a component as these games have their own rendering techniques. This in turn allows us to understand more of the product better and spot strengths and weaknesses that wouldn’t be possible if we only limited ourselves to certain genres or game engines.
Currently, we test over 10 games with different genres and engines from older titles such as CSGO to the latest releases such as Spiderman Miles Morales(at the time of writing) to provide extensive coverage. Games are also selected based on the features and technologies available such as Ray Tracing, DLSS, Reflex, FSR, and other features, especially for GPU Benchmarks.
We’ll have a separate article discussing our synthetic and game benchmark selection and how it contributes to the review.
Dilemma Between In-Game Benchmark Tool and Custom Scenes
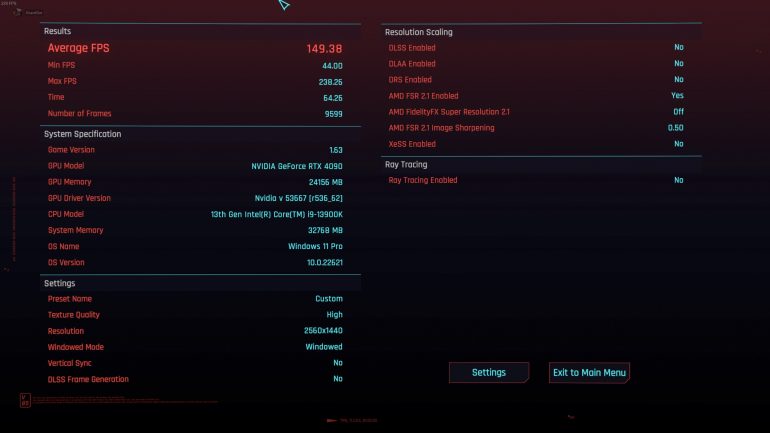
Now on to the dilemma of using canned, in-game benchmark runs versus doing our own custom runs. In-game benchmarks have been known to produce the best FPS numbers possible which in some cases may or may not reflect the actual in-game framerates that users are getting. However, the same can be said with custom runs as there scenes selected by other reviewers may be CPU-heavy, GPU-heavy, or memory-intensive which in turn will also affect the FPS result in their respective tests. A prime example of this are weather conditions, crowd spawns, and NPC behavior in some games which affect framerates, especially in systems or components that have low memory. That said, there are notable games that have very extensive and balanced benchmark runs such as Cyberpunk 2077, F1 22, Rainbow Six Siege, Returnal, and CODMW2.
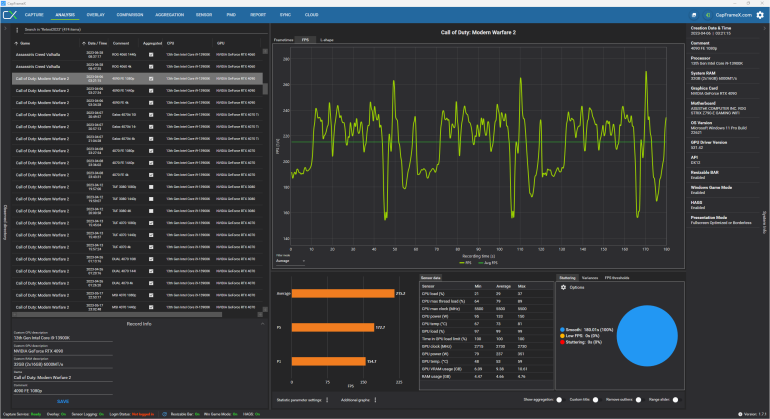
That said, our aim for repeatability and verifiable data in our benchmark methodology leads us to use some of the in-game benchmark runs. Also, our current manpower cannot cater to the demands of having all-out gameplay benchmarks as benchmarking itself takes a huge chunk of our time, especially custom benchmark sequences – we do still have to produce reviews in a timely manner, especially for launch day reviews. Our choice to use CapFrameX as a benchmark tool is a big factor to combat the downsides of in-game benchmarks as we have a third-party tool measuring the actual frame times thus not relying upon the numbers presented by the game itself. In games where there are no built-in runs, we do have our own scenario particularly at the start of the game or in areas where you’ll spend most of the time on regardless of progress.
To further reduce inconsistencies and variances, all of our game benchmarks are run in 60 seconds three times, and we take the average results generated by CapFrameX as our final reference data. Benchmark runs are aggregated by the app itself with a 3% outlier tolerance to minimize framedrops, spikes, etc. Games are then tested in max or ultra settings to minimize any potential bottlenecks in the system. We don’t enable proprietary technologies such as HairWorks, HBAO+, or DLSS by default unless stated and it’s required to be tested ie – RTX 40 series GPU reviews. In the case where games receive updates during the testing process, the products tested prior to the update will be discarded and retested in order to maintain uniformity and fairness.
Data Presentation – Min/Avg/Max is Misleading
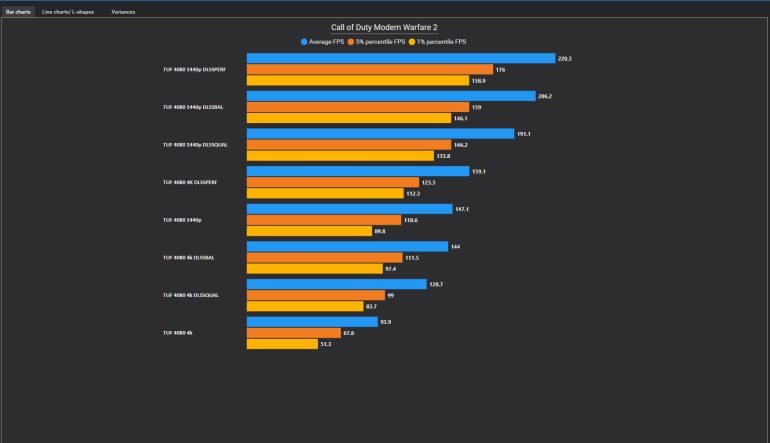
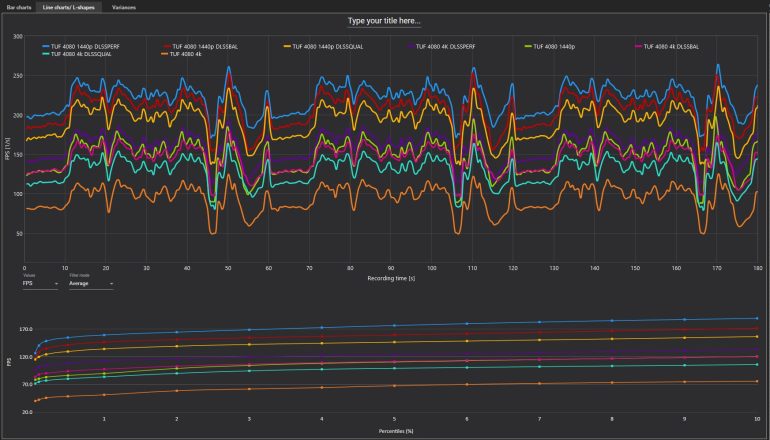
After doing benchmarks, we take the necessary data collected by CapFrameX and turn it into simple graphs that are easily digestible. While uploading CapFrameX analysis, comparison, and sensor tab charts provides more information, it contradicts our target of easy-to-digest data. Of course, the graphs have a little bit of Gadget Pilipinas branding to prevent potential plagiarism.
Our main metrics for our gaming benchmarks are Average FPS and 1% FPS for a better representation and understanding of a product’s performance. We believe that presenting Min/Avg/Max FPS graphs is misleading as the Min and Max values are only a “single” data point throughout the whole benchmark run regardless of the duration. These extreme values are not representative of the supposed performance as these are generated by unpredictable causes such as stuttering due to bad drivers, poor game optimization, or bottlenecks. With the Avg FPS paired with 1% FPS(or 99th percentile) reading, we could clearly see the product’s relative performance much better than the typical Min/Avg/Max graph. The 1% FPS(or 99th percentile) reading is simply an average of the lowest recorded frames.
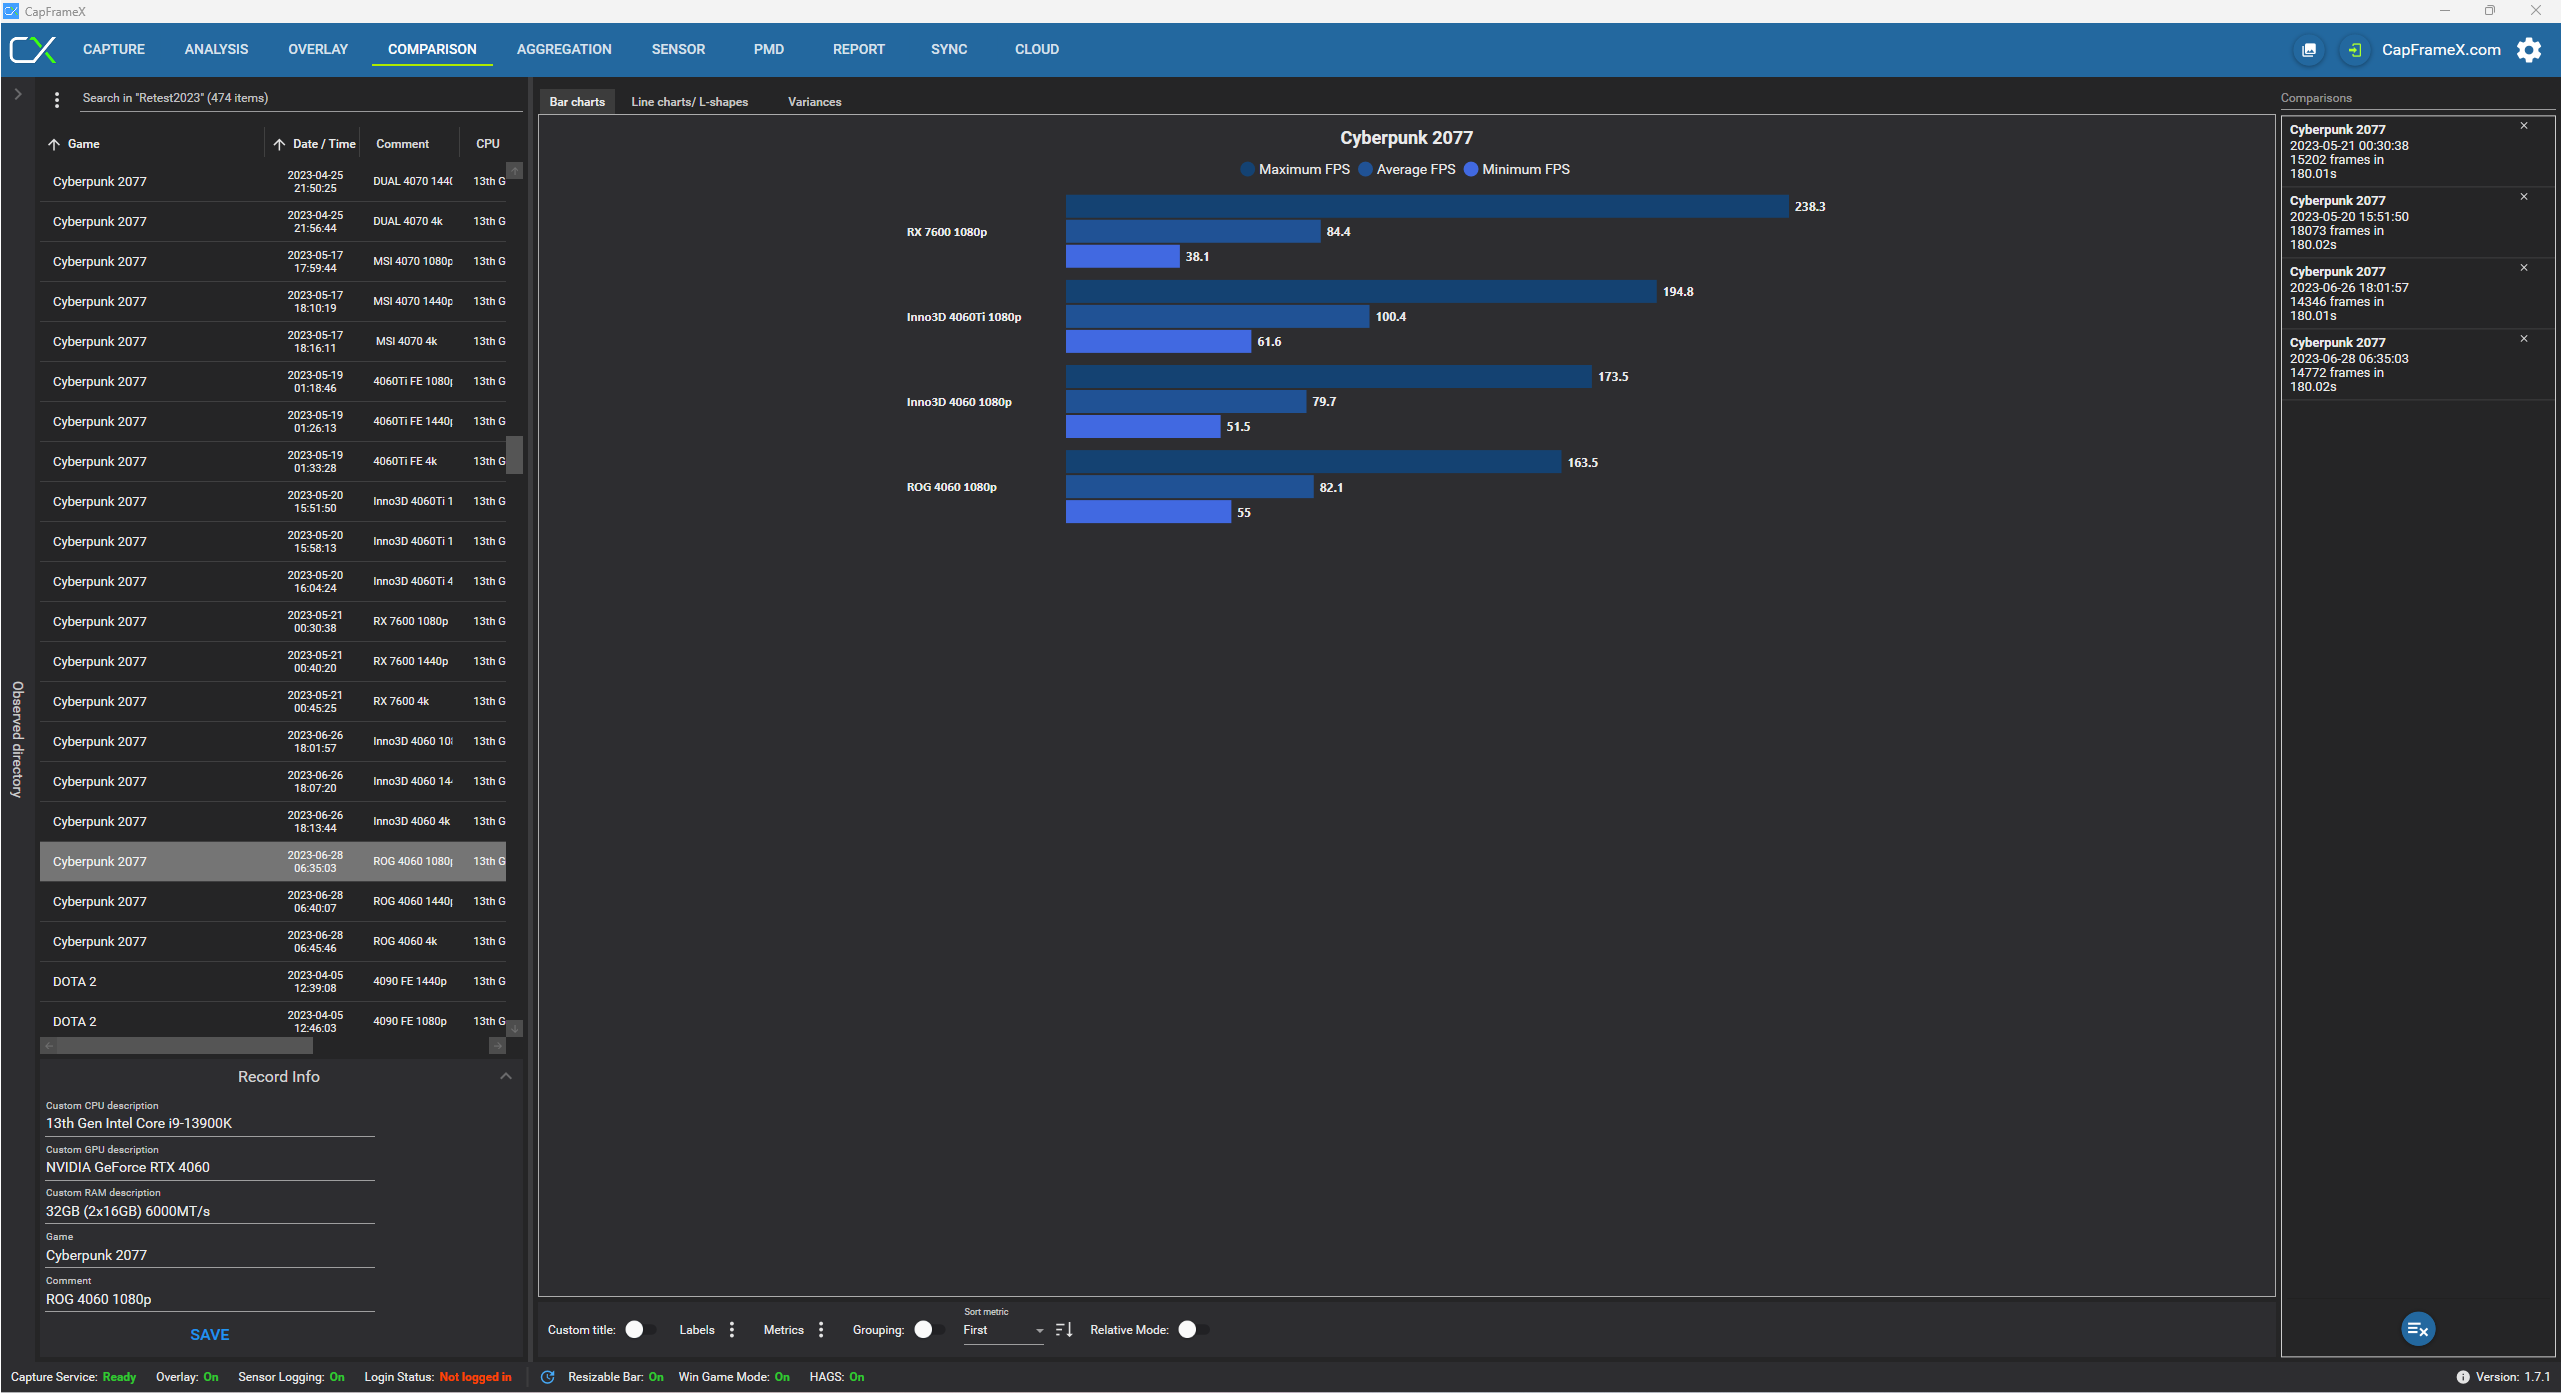
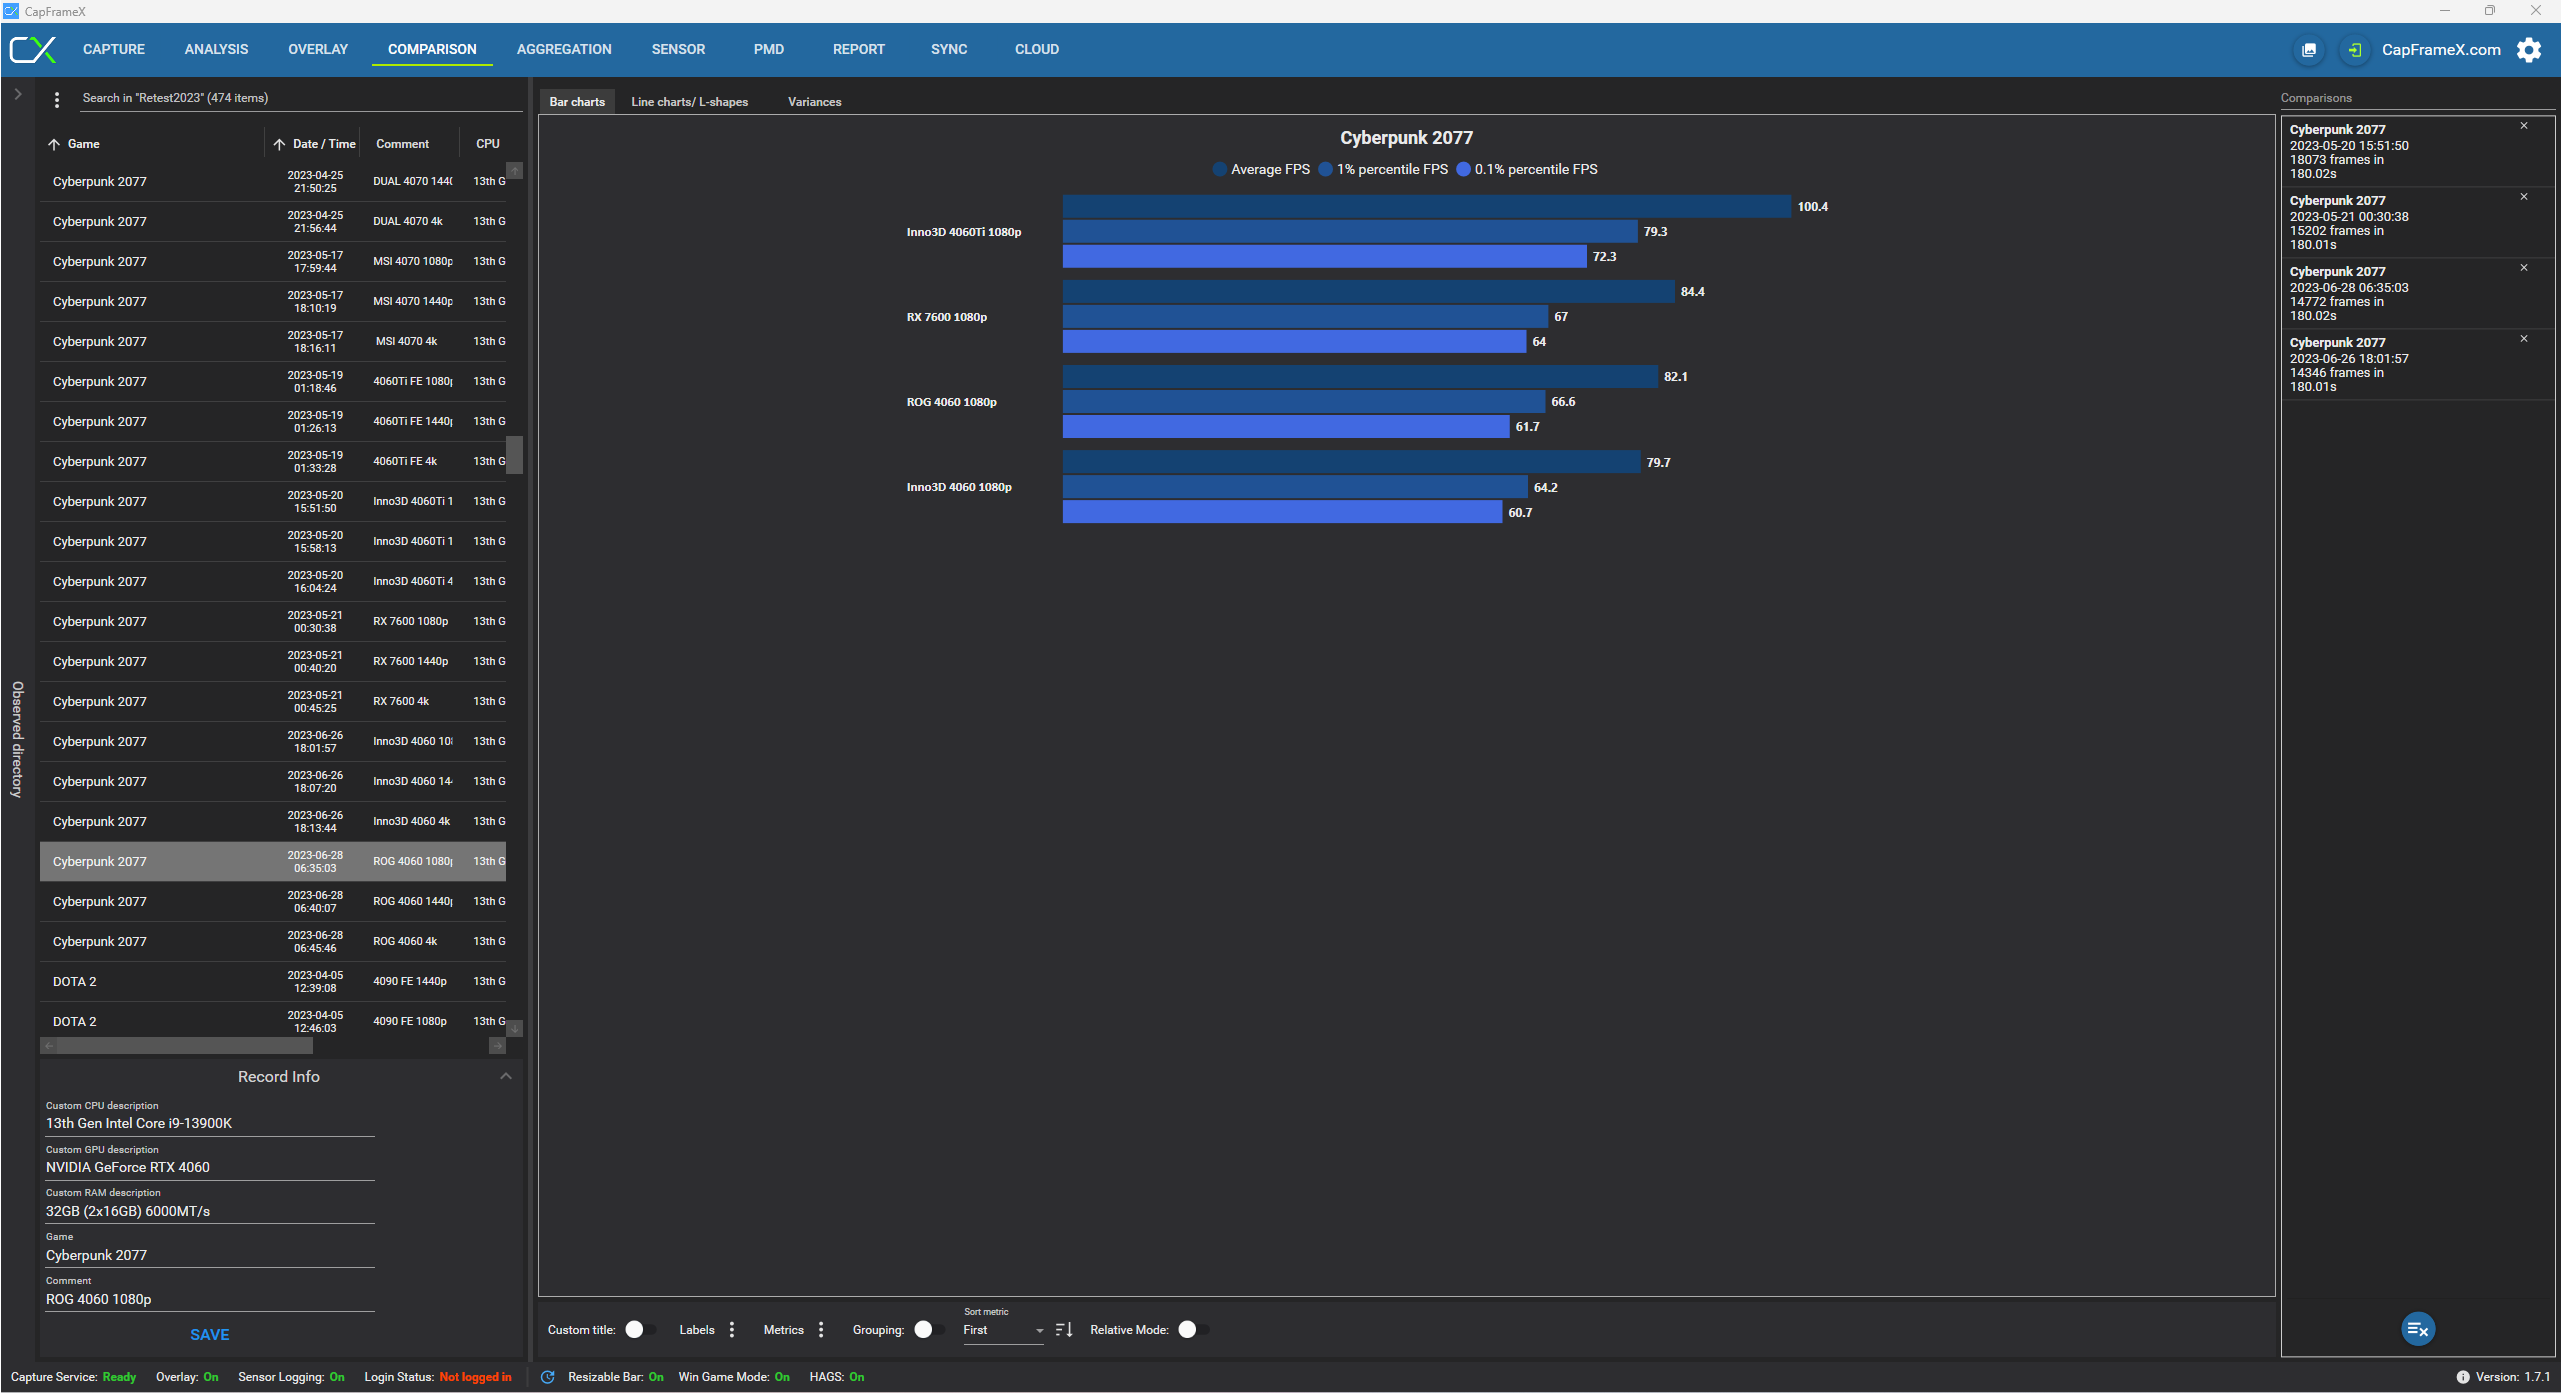
For example, let’s take a look at our Cyberpunk 2077 benchmark at 1920x 1080p using the RTX 4060 Ti, RTX 4060, and RX 7600 GPUs. When we use the dated Min/Avg/Max data, it shows that the RX 7600 produced the highest max FPS of 238.4 FPS compared to the more powerful RTX 4060 Ti which only rendered 194.8 MAX FPS but has a much higher average framerate of 100.4 vs the RX 7600’s 84.4 FPS. Moreover, you’d also think that the cards have a large performance gap among each other due to the Max FPS and Min FPS making some GPUs look significantly way worse or better than others. However, when we shift the data to Avg FPS and 1% FPS you could see that the RTX 4060 Ti is indeed the best among the four and that the RX 7600 will give you a much smoother gaming experience than the RTX 4060’s due to it having a higher 1% FPS despite having the lowest Min FPS across the stack.
To know more about Min/Avg/Max vs Avg/1% FPS we suggest reading Tech Report’s article or watching Bitwit’s explainer video.
Final Thoughts – Never Ending Work In Progress
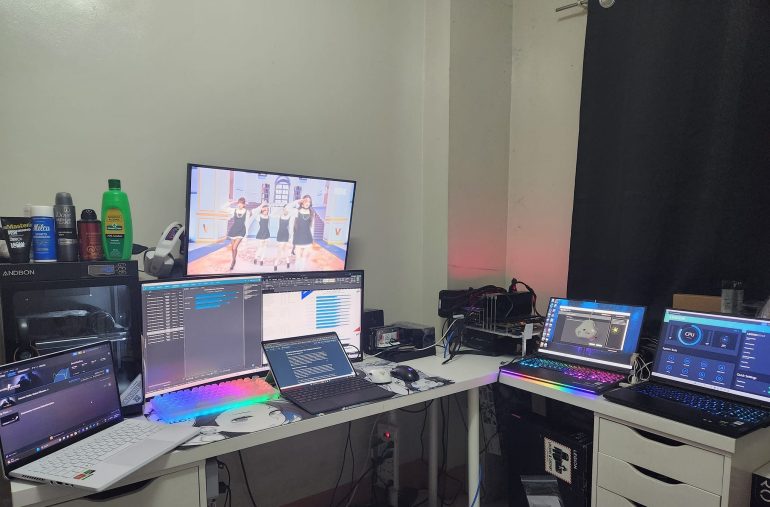
We are inspired by the quality of work demonstrated by our peers, LinusTechTips, Gamers Nexus, and Back2Gaming which have established their own techniques, benchmark methodologies, and data presentation. While still imperfect, we believe that our current level of benchmark process in our reviews is one of the fairest in the industry. We believe that in order to be a trusted publication for tech reviews like the like ones mentioned earlier, we must first be transparent with our testing process and provide accurate and verifiable data to our audience.
At the end of the day, we’re not aiming in being a very technical data-driven publication like Gamers Nexus and Digital Foundry. Our goal is to be transparent in our review process from data collection, presentation, and interpretation. While our current methodology is nowhere near perfect, expect us to improve and refine our process over time in order for us to deliver the impartial and objective reviews that Gadget Pilipinas is known for.
That said, thank you to our readers who place their trust in our reviews especially when it comes to purchase decisions of the products we review. Also, thank you to our supportive brand partners who value and respect our stringent testing and review ethics.
If you have any feedback or suggestions regarding our benchmark methodology please do drop a comment or email our PC Reviews Lead, GrantSor.
Grant is a Financial Management graduate from UST. His passion for gadgets and tech crossed him over in the industry where he could apply his knowledge as an enthusiast and in-depth analytic skills as a Finance Major. His passion allows him to earn at the same time help Gadget Pilipinas' readers in making smart, value-based decisions and purchases with his reviews and guides.

